
SLIDE 1
Michael Greenacre
Universitat Pompeu Fabra Barcelona
Michael Greenacre
Universitat Pompeu Fabra Barcelona
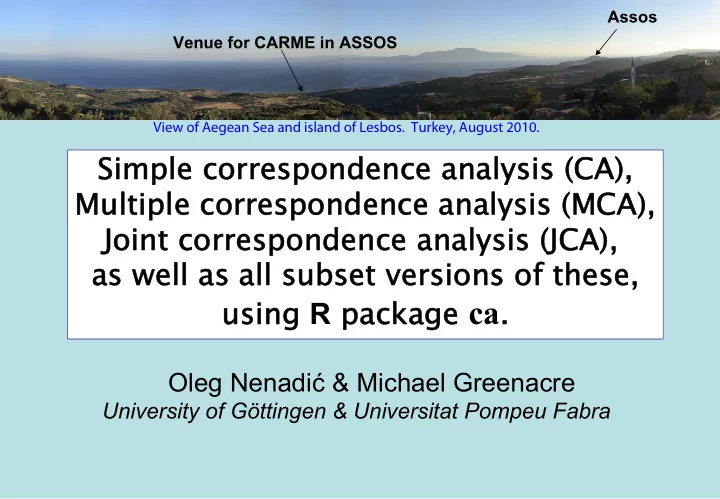
Simple correspondence analysis (CA), Simple correspondence analysis (CA), Multiple correspondence analysis (MCA), Multiple correspondence analysis (MCA), Joint correspondence analysis (JCA), Joint correspondence analysis (JCA), as well as all subset versions of these, as well as all subset versions of these, using using R package package ca.
Oleg Nenadić & Michael Greenacre
University of Göttingen & Universitat Pompeu Fabra
View of Aegean Sea and island of Lesbos. Turkey, August 2010.