
SLIDE 1
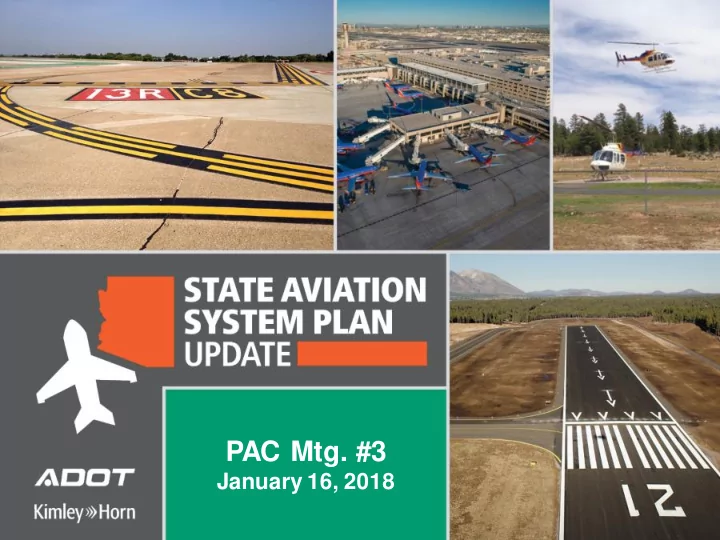
PAC Mtg. #3
January 16, 2018
PAC Mtg. #3 January 16, 2018 Ag Agenda Introductions SASP - - PowerPoint PPT Presentation
PAC Mtg. #3 January 16, 2018 Ag Agenda Introductions SASP progress update Overview of existing policy Review final airport classifications Present aviation forecast results Review systems current performance
PAC Mtg. #3
January 16, 2018
Ag Agenda
Polic
mplications tions
development
change since last SASP reflect the policies
evaluation of existing and future system performance and needs
Ma Major Policy Changes (2009-2017)
1. ADOT Aeronautics Division re-organized as a Group under ADOT MPD 2. State Aviation Fund
million gallons
dedicated to air transportation
State Aviation Fund
3. A.R.S. 28-8202 changed the eligibility criteria for state funding to include Tribal airports 4. Five-Year Airport Development Guidelines
(APMS) grants on-hold through 2019
2017 SASP Criteria
‒ Commercial service, domestic or international / seasonal or year- round ‒ Reliever status ‒ Instrument operations ‒ Operations ‒ Based aircraft ‒ Fuel availability
2017 M 2017 Methodol ethodolog
Classification/Role 2008 SASP 2017 SASP Update Role Parameters Typical Characteristics Commercial Service- International
Publicly owned airports which enplane 2,500 or more passengers annually and receive scheduled passenger air service International commercial service Year-round scheduled commercial service to international destinations for people and cargo. High levels of activity with many jets and multiengine propeller aircraft.
Commercial Service- National
Domestic commercial service Scheduled commercial service to domestic destinations for people and cargo. May provide seasonal scheduled commercial service to a limited number of international destinations. Moderate to high levels of activity with jets and multiengine propeller aircraft.
Reliever
FAA-designated airports that relieve congestion at a commercial service airport FAA-designated airport that relieves congestion at a commercial service airport Serves to relieve congestion at commercial service airports. Supports the national air system and provides access to markets across the U.S. Moderate to high levels of activity with jets and multiengine propeller aircraft.
GA-Community
Airports that serve regional economies, connecting to state and national economies, and serve all types of general aviation aircraft 250 instrument operations, 10 based aircraft or 1 based jet, and aircraft fuel Support regional economies and provides access to markets in Arizona and nearby states. Moderate levels of activity with jets and multiengine propeller aircraft.
GA-Rural
Airports that serve a supplemental role in local economies, primarily serving smaller business, recreational, and personal flying 2,500 operations or 10 based aircraft and aircraft fuel Supplements local economies and provides access to markets in Arizona with limited activity in nearby states. Moderate to low levels of activity with few or no jets and multiengine propeller aircraft.
GA-Basic
Airports that serve a limited role in the local economy, primarily serving recreational and personal flying All other general aviation airports Supports local communities by providing general aviation services such as emergency response services, charter or medical flights, wildland firefighting, or recreational flying. Low levels of activity primarily composed of single or multiengine piston aircraft.
The Arizona airport system is defined as all public-use airports owned by a political subdivision
government.
Relationship to the NPIAS / 2008 SASP
2017 SASP Classification Total NPIAS Non- NPIAS Commercial Service- International 2 3 Commercial Service- National 9 8 Reliever 8 8 GA-Community 18 18 GA-Rural 17 14 3 GA-Basic 13 8 5 TOTAL 67 59 8 Associated City Airport FAA Identifier 2017 SASP Douglas Cochise College P03 GA-Rural Douglas Douglas Municipal DGL GA-Rural Kearny Kearny E67 GA-Basic San Luis Rolle Airfield 44A GA-Rural Seligman Seligman P23 GA-Basic Sells Sells E78 GA-Basic Superior Superior E81 GA-Basic Tombstone Tombstone Municipal P29 GA-Basic
2017 Non-NPIAS Airports 2017 SASP/NPIAS Relationship
Role/Classification 2008 SASP 2017 SASP Total Change Commercial Service- International 11 2 2 Commercial Service- National 9 9 Reliever 8 8 8 GA-Community 24 18 i6 GA-Rural 19 17 i2 GA-Basic 5 13 h8
2017 SASP compared to 2008 SASP
Facility and Se Service Objectives
services and facilities based on classification
Component Airport Criteria General Airfield ARC Runway Surface Runway Length Approach Capability Taxiway Visual Aids Lighting Approach Lighting System Airside Facilities Operations/Maintenance Hangar Hangars Auto Parking Apron Terminal/Pilot's Lounge Services Fixed-base operator (FBO) Aircraft Maintenance Avionics Sales and Service Off-Site Rental Car On-Site Rental Car Restroom Phone U.S. Customs Fuel Deicing Snow Removal Oxygen Weather Reporting Air Taxi/Charter Service Aircraft Rental
Elements lements of
ecasts ts Tas ask
Terminal Area Forecast (TAF) for NPIAS airports
commercial activity
activity by turbo jet and prop aircraft over 12,500 pounds
Socioeco
nomic Factor actors
Aviation Demand Population Age
Employment
Gross Regional Product Income Tourism
Assuming the nation does not experience another significant recession, projected population and economic levels should create positive ripple effects in both commercial service and general aviation activity in the state through the planning horizon.
Comme mmercial Se Service Forecast Methodology
airports to the FAA on an annual basis
activity levels in the TAF for:
source for all commercial forecasts
23,688,599 26,399,942 29,032,371 35,023,816 20,000,000 22,000,000 24,000,000 26,000,000 28,000,000 30,000,000 32,000,000 34,000,000 36,000,000 2016 2021 2026 2036 Total Enplanements Year
Commercial Enplanements
CAGR = 1.97%
Projected
Commercial Service
Source = TAF
830,011 880,045 938,531 1,071,479
750,000 800,000 850,000 900,000 950,000 1,000,000 1,050,000 1,100,000
2016 2021 2026 2036 Annual Operations Year
Air Carrier and Air Taxi/Commuter Operations
CAGR = 1.28%
Projected
Commercial Service
Source = TAF
980 1,039 1,111 1,270
900 950 1,000 1,050 1,100 1,150 1,200 1,250 1,300 2016 2021 2026 2036
Based Aircraft Year
General Aviation Based Aircraft at Commercial Service Airports
CAGR = 1.30%
Projected
Commercial Service
Source = TAF
654,091 660,569 668,324 685,801 158,897 158,897 158,897 158,897 830,011 880,045 938,379 1,071,138 1,642,999 1,699,511 1,765,600 1,915,836
100,000 250,000 400,000 550,000 700,000 850,000 1,000,000 1,150,000 1,300,000 1,450,000 1,600,000 1,750,000 1,900,000 2,050,000 2016 2021 2026 2036 Operations Year
TAF Total Operations
General Aviation Military Commercial Service Total
Projected
CAGR = 0.77%
Commercial Service
Source = TAF
FAA Advisory Circular 150/5050-7, The Airport System m Planning Process:
share
GA Forecast Methodologies
General Aviation
Level of detail in the forecasts should be based upon airports’ activity, planning issues to be addressed, and the future use of the forecasts.
Total increase = 1.59%
General Aviation
Aircraft Type 2016 2021 2026 2036
Single-engine piston
3,835 4,167 4,518 5,261
Multi-engine piston
453 493 532 621
Jet
242 261 285 335
Rotorcraft/helicopter
135 146 157 187
Glider
12 12 13 15
Ultralight
75 130 87 104
Military
2 2 2 3
Total
4,754 5,161 5,594 6,526
Preferred Based Aircraft Forecast (Population Growth Method)
1,240,350 1,401,760 1,585,910 2,035,920 1,080,574 1,222,060 1,383,560 1,777,980 2,320,920 2,623,820 2,969,470 3,813,900
1,000,000 1,500,000 2,000,000 2,500,000 3,000,000 3,500,000 4,000,000 2016 2021 2026 2036 Operations Year
Preferred GA Operations Forecast (ARC Method)
Local Itinerant Total
Projected
Total increase = 2.53%
General Aviation
Key ey For
ecast t Tak ake-aw away ays
country over the next 20 years
to outpace the national average due to:
increases of 1.28% in based aircraft and 1.30% in air carrier/air taxi operations by 2036.
1.59% in based aircraft and 2.53% in general aviation operations by 2036.
Sy System m Performa mance Assessme ment
to evaluate how the current airport system meets needs:
serve existing and future needs
system
PM - Safety & Security
Percent of airports capable of supporting medical
approach capability
feet
8% 6% 39% 38% 67% 100% 30% 92% 94% 61% 63% 33% 70% 0% 10% 20% 30% 40% 50% 60% 70% 80% 90% 100% GA – Basic GA – Rural GA – Community Reliever Commerical Service – National Commercial Service – International System-wide Percent of Airports Airport Classifications Capable of Supporting Medical Operations Incapable of Supporting Medical Operations
PM - Safety & Security
Percent of airports with surrounding municipalities that have adopted controls/zoning, including “disclosure areas,” to make land use in the airport environs compatible with airport operation and development
8% 24% 17% 88% 25% 100% 30% 46% 76% 83% 100% 78% 100% 76% 0% 10% 20% 30% 40% 50% 60% 70% 80% 90% 100% GA – Basic GA – Rural GA – Community Reliever Commercial Service – National Commercial Service – International System-wide Percent of Airports Airport Classification Adopted Controls/Zoning Adopted Disclosure Areas
PM - Safety & Security
Percent of airports that have Runway Safety Areas (RSA)
current Airport Reference Code
85% 82% 89% 75% 89% 100% 85% 15% 18% 11% 25% 11% 15% 0% 10% 20% 30% 40% 50% 60% 70% 80% 90% 100% GA – Basic GA – Rural GA – Community Reliever Commercial Service – National Commercial Service – International System-wide Percent of Airports Airport Classifications Meets RSA Standards on Primary Runway Does Not Meet RSA Standards on Primary Runway
SI - Safety & Security
Percent of airports that support aerial firefighting
38% 76% 94% 75% 78% 100% 75% 0% 10% 20% 30% 40% 50% 60% 70% 80% 90% 100% GA-Basic GA-Rural GA-Community Reliever Commercial Service-National Commercial Service-International System-wide Percent of Airports Airport Classifications Supports Aerial Firefighting Operations
PM - Fiscal Responsibility
Percent of statewide population within a 30-minute drive time of each airport, by role classification 93 percent
within 30 minutes of a system airport
PM - Fiscal Responsibility
Percent of population within 30 minutes of a NPIAS airport 93 percent
within 30 minutes of a NPIAS airport
PM - Fiscal Responsibility
Percent of population within 30 minutes of an all-weather runway (paved, instrument approach, weather reporting)
90 percent
within 30 minutes of an all-weather runway
Number of airports with a current (past five years) master plan
PM - Fiscal Responsibility
38% 53% 33% 50% 56% 50% 45%
62% 47% 67% 50% 44% 50% 55%
0% 10% 20% 30% 40% 50% 60% 70% 80% 90% 100% GA – Basic GA – Rural GA – Community Reliever Commerical Service – National Commercial Service – International System-wide Percent of Airports Airport Classifications MP/ALP in last 5 years MP/ALP Older Than 5 Years
Percent of airports with a Pavement Condition Index (PCI) of 70 or greater
PM - Fiscal Responsibility
31% 41% 61% 88% 89% 50% 57%
69% 59% 39% 13% 11% 50% 43%
0% 10% 20% 30% 40% 50% 60% 70% 80% 90% 100% GA – Basic GA – Rural GA – Community Reliever Commercial Service – National Commercial Service – International System-wide Percent of Airports Airport Classifications PCI of 70 or Greater PCI Less Than 70
PM - Economic Support
Percent of airports with 24/7 fuel
15% 35% 39% 63% 67% 100% 42% 8% 59% 61% 100% 67% 100% 57% 15% 71% 61% 100% 78% 100% 63%
0% 10% 20% 30% 40% 50% 60% 70% 80% 90% 100% GA – Basic GA – Rural GA – Community Reliever Commercial Service – National Commercial Service – International System-wide Percent of Airports Airport Classifications Any 24/7 Fuel Service 24/7 Jet A 24/7 Avgas
Percent of airports with the facilities to support jet aircraft
8% 18% 72% 63% 89% 100% 48% 92% 82% 28% 38% 11% 52% 0% 10% 20% 30% 40% 50% 60% 70% 80% 90% 100% GA-Basic GA-Rural GA-Community Reliever Commercial - National Commercial - International System-wide Percent of Airports Airport Classifications Meets Jet Aircraft Needs Does Not Meet Jet Aircraft Needs
PM - Economic Support
Percent of system airports supporting flight training
8% 24% 56% 100% 33% 50% 40%
18% 28% 12% 12% 3% 24% 11% 33% 13% 92% 24% 6% 33% 50% 31%
0% 10% 20% 30% 40% 50% 60% 70% 80% 90% 100% GA-Basic GA-Rural GA-Community Reliever Commercial - National Commercial - International System-wide Percent of Airports Airport Classifications Daily Weekly Monthly Seasonal/Occasional Never
SI - Economic Support
Facility and Se Service Objectives
guidance on the minimum level of development that airports should strive to achieve
determine if facilities and objectives appropriate for a specific airport
important data for the cost analysis conducted in the next phase of the study
2008 SASP SASP Su Summa mmary of Needs
Short- Term (2009- 2013) Mid-Term (2014- 2018) Long- Term (2018- 2030) Total SASP
$933.79 $542.38 $975.17 $2,451.34
ADOT CIP
$504.35 $0.00 $0.00 $504.35
Airport Master Plans/CIPs
$1,241.22 $1,847.36 $3,506.47 $6,595.04
Other*
$87.90 $24.72 $57.55 $170.17
Total
$2,767.27 $2,414.45 $4,539.19 $9,720.91
All System Needs through 2030 ($Million) Total System Needsthrough 2030 by Airport Role ($Million)
GA-Basic, $10.49 , 0% New Airports, $164.51 , 6% Commercial Service, $1,294.17 , 50% Reliever, $591.96 , 23% GA-Community, $398.37 , 15% GA-Rural, $156.34 , 6%
*Includes costs developed for the construction and maintenance
Network Center, and future system planning needs.
Key Recomme mmendations of the 2008 SASP SASP
standards for RSAs, RPZs, and runway-taxiway separation
airport disclosure maps
potential constraints in Phoenix and Tucson areas
pavement program, as 50 percent of costs were dedicated to maintaining pavement
Future Performa mance Ex Exercise
for this discussion:
end Runway Protection Zones (RPZs)
performance is provided
future performance targets:
Exercise
Today’s Accomplishments
discussion
Next S xt Steps teps
Policy, Forecast, and Current Performance Assessment chapters
targets
airport improvement projects and summarize to determine statewide needs
23rd – 25th in Mesa, Tucson, and Flagstaff
Thank hank You!
P: (602) 712-7597 E: MSmith3@azdot.gov
Project Manager P: (480) 207-2670 E: pam.keidel-adams@kimley-horn.com www.azdot.gov/SASPUpdate
Contact
PAC Meeting 3 Summary January 16, 2018 | Page 1
SASP Update Planning Advisory Committee (PAC) Meeting 3 Summary
Date, Time
January 16, 2018; 2:00 – 4:00 PM
Location
Arizona Department of Transportation (ADOT) 206 South 17th Avenue, Room 145 (Transportation Boardroom)
PAC Attendees
Attendees: ☒ Zenia Cornejo, Falcon Field Airport ☒ James Timm, Arizona Pilots Association (APA) ☒ Mike Smejkal (Tucson Airport Authority) ☒ Randy Paine (City of Phoenix Aviation Department) Consultant Staff: ☒ Pam Keidel-Adams (PKA), Kimley- Horn (KHA) ☒ Jarrett Humble (JH), KHA ☒ Catherine Woodwell (CW), KHA ADOT Aeronautics ☒ Don Kriz (DK), ADOT Aeronautics ☒ Matt Smith (MS), ADOT Aeronautics
1 Introductions and Agenda
2 SASP Process and Task Updates
performance assessment task to discuss targets and potential policy recommendations.
3 Policy Implications & Airport Classifications
the last SASP (2009-2017).
Airport Pavement Management System (APMS) will continue to conduct pavement inventories; construction projects are on-hold until 2019. State/Local (SL) grants on-hold through 2020.
to address commercial passengers, not cargo. The existing criteria may be too narrow, as the methodology may want to consider looking at cargo, customs, etc. Tucson International Airport (TUS) would currently be excluded from Commercial Service-International because the airport does not currently have international service for passengers.
customs or “on-call” customs service. For example, Nogales International can provide customs service on an as-needed basis.
PAC Meeting 3 Summary January 16, 2018 | Page 2
international cargo. Classification methodology may consider assessing airports’ international cargo service.
4 Forecasts of Aviation Activity
general aviation forecast task.
aviation activity.
country over the next 20 years.
This task is nearing completion and will be submitted for FAA review in the near future.
5 Current System Performance Assessment
Back-up data are available for all outcomes presented during the meeting and in the chapter.
the Arizona Revised Statutes (A.R.S.) and was addressed as a policy recommendation in the 2008 SASP.
themselves at risk for issues such as noise complaints, safety issues, and encroachment.
guidance for land planning is old; updated guidance is in the
Department of Real Estate (ADRE) are dated; current maps are not being re-filed with the agency as airports change over time.
disclosure maps with the ADRE and filing maps with local authorities can be challenging. Additionally, there is no time limit for updating maps, which could explain why some maps appear to be dated. He also noted that the dates of the maps may not indicate that they are outdated. If there have not been many changes at an airport, the maps may still be relevant. Also, in some cases, larger footprints in older maps may be useful to protect airports from encroachment.
policy recommendation to help ADOT improve airports’ compliance with this measure.
PAC Meeting 3 Summary January 16, 2018 | Page 3
runway that meet the standards for their current Airport Reference Code (ARC)
airports are non-compliant). This is an issue that should be specifically looked at in the future.
evaluation, as most airports update their master plans every seven to 10 years. ▪ PKA said we will discuss the potential of revising this criteria with ADOT Aeronautics. All of the data has been
evaluations could be conducted as deemed necessary. It may be more appropriate to amend the performance measure to a seven to 10-year timeframe.
master plan updates that frequently, as updates are lengthy processes that can take years. In many cases, airports will conduct specific planning studies without updating the entire master plan.
unless an airport is new.
(ALP) is approved after a master plan/master plan update. ▪ PKA says that ALPs can remain under review with the FAA for a long time for many reasons, including any issues with the ALP and the agency’s overall workload.
classifications and non-NPIAS airports.
for jets.
Matt Smith answered that revenue-producing projects are not eligible for state grants, including those for fuel.
inventory: to identify service/facility gaps to help prioritize investment and policy decisions.
PAC Meeting 3 Summary January 16, 2018 | Page 4
airport improvement projects must be funded before that can
thinks a lot of cities will not build hangars because of restrictive building codes. The requirements are such that airports need private enterprises to invest in and build hangars.
compete for funds with other infrastructure projects for the general public, like roads. It is difficult for leadership to pay for projects that only benefit a small sub-set of the population (e.g., hangars), instead of for the benefit of the general public. ▪ Jim Timm stated that Falcon Field is self-sustaining, and that the money for airport improvements is not coming
training, particularly in the central and southern portions of the state.
congestion and safety concerns for pilots and airports. The FAA is not funding new instrument landing systems (ILSs), so many pilots are using a limited number of airports for certification flights (such as Casa Grande). An ILS for general training would be helpful, perhaps on a runway outside of Phoenix used exclusively for training. The FAA could also consider changing the requirement to use a GPS approach at an active airport during certification flights.
training and may help these issues. The APA has been working for years to address the need for a new ILS for student pilots.
recommendation addressing the need for new ILS equipment or a change in GPS approach requirements to address concerns relating to the flight training activity occurring in the state.
used to inform the needs assessment that will conducted as the next stage in the process. The 2008 summary of needs was presented to show attendees the next phases of the SASP Update.
targets that will be developed for all performance measures.
PAC Meeting 3 Summary January 16, 2018 | Page 5
▪ Group discussed if the PCI performance measure should be evaluated for the overall performance of all pavement, just the primary runway, or some other sub- set of pavements. ▪ Group decided that the SASP Update should develop specific targets for runways, taxiways, and aprons. Threshold is established as 55% of airports for aprons and 70% of airports for runways and taxiways.
▪ Group decided that 100% of airports at the General Aviation-Community classification and above should have 24/7 fuel.
Protection Zones (RPZs) ▪ Matt Smith commented that ADOT Aeronautics is unable to fund the acquisition of land for RPZs. ▪ From this perspective, is it still important to have airports plan for this? In most cases, airports would gain control via avigation easements, unless can get land acquisitions through the FAA. General consensus is that it is difficult to maintain and preserve land to control an RPZ. ▪ Randy Payne said another solution could be zoning to preclude development near RPZ. ▪ PKA asked if this should this be a policy guidance instead
that all airports should strive to control 100% of RPZs, but due to major funding obstacles, a policy recommendation is more appropriate than a performance target.
feedback/input on the all performance targets.
6
Next Steps and Conclusion
Flagstaff.
Riddle Aeronautical University in Prescott, and Pima Association of Governments (PAG).
ADOT Communications Group.
PAC Meeting 3 Summary January 16, 2018 | Page 6
airports/consultants.
PAC Meeting 3 Summary January 16, 2018 | Page 7
Action Items
Date Action Item Owner Status/Notes
01/16/18 Update policy slide and chapter in accordance with the current status of FSL and SL grants KHA Ongoing Review/revise classification methodology to improve the criteria for Commercial Service- International airports KHA/ADOT Ongoing Review the need to revise the master plan performance measures to evaluate if airports have updated their master plans within the last seven to 10 years instead of within the last five years. KHA /ADOT Ongoing Differentiate performance measures of PCI for runways, taxiways, and aprons KHA Ongoing