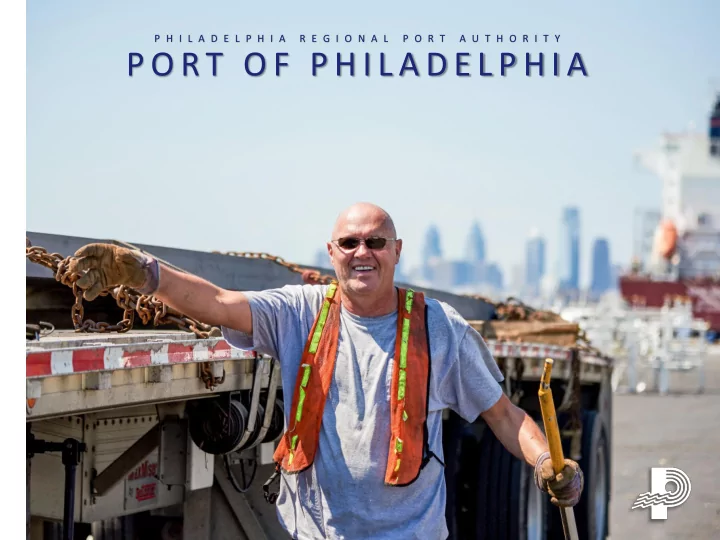

P H I L A D E L P H I A R E G I O N A L P O R T A U T H O R I T Y P O R T O F P H I L A D E L P H I A
PRPA at a Glance 6 th consecutive year of sustained growth Channel deepening continues • PRPA Management on track • New deeper main channel to be completed by 2017 Successful Re-tooling of the Tioga Marine Terminal • New customers show strong interest Southport; Fall 2015 RFQ – Spring 2016 RFP • PRPA has invested approximately $30 million on site prep work PRPA hits record volumes in Import car volumes New shipping service from Mexico. New S. American services APL, NYK, SeaLand and Yang Ming at PAMT New paper customer at Piers 38 & 40, 70,000 MT – 12 ships 2
Big Ships • Channel deepening will allow the Port of Philadelphia to accommodate vessels up to 10,000 TEU ships. An extensive capital improvement program to PAMT will allow it to handle larger vessels. 3 • New Panama Canal will accommodate vessels up to 12,500 TEUs.
Delaware River Deepening Current Depth: 40 Feet (12.19 meters) Future Depth: 45 feet (13.72 meters) Length: 103 miles Cost Estimate: $365 million Material: 16 million cubic yards of dredge materials *The Delaware River has a 6 foot (1.83 meter) tide Duration: 7 years Sponsor: U.S. Army Corps of Engineers Local Sponsor: Philadelphia Regional Port Authority Progress: 80% completed. Expected completion in 2017 4
PRPA Facilities 16 Facilities, 1,000 Acres of Property 1 15 11 12 13 2 14 3 16 11 . 3200 Tioga 4 12. PRPA Admin Building 13. Tioga Liquid Bulk 5 Terminal ( Kinder Morgan) 6 14. Tioga Marine Terminal 15. PRPA Lot on Essington 1. Piers 38 & 40 Avenue 2. Philadelphia Forest 16. Philadelphia Wholesale Products Center Produce Market (Piers 78 & 80) 7 3. Pier 82 Other 17 4. Pier 84 17. CSX Intermodal 5. Piers 96, 98 & 100 Greenwhich Yard 6 . Philadelphia Auto 19 18. NSRC Intermodal 8 Processing Facility 19. Conrail Loop 7. Packer Avenue Marine 9 18 Terminal 8. Pier 122 10 9. Pier 124 10. Southport Marine Terminal Complex 5
Port Facilities Core Facilities Philadelphia Forest Products Center – Piers 78/80 Tioga Marine Terminal and Piers 38/40 (inset) Pier 82 Pier 84 6
Port Facilities Core Facilities Philadelphia Wholesale Produce Market Philadelphia Auto Processing Facility Piers 122 & 124 7 Packer Ave Marine Terminal
Five Years of Double Digit Growth 5,970,480 Total Metric Tons -- 2010 thru 2014 +17% 6,000,000 5,100,385 +15% 5,000,000 4,431,214 +11% 4,001,759 3,628,312 +10% 4,000,000 +14% 3,000,000 2,000,000 1,000,000 0 2010 2011 2012 2013 2014 Cargo increase averages: TEUS 19.36%, Breakbulk 14.44%. Liquid Bulk 13.39%, Auto 18.12% and Total Metric Tonnage 16.66% 8
Distribution Centers – Imports Continue to locate in PRPA Hinterland Fifth Largest Metropolitan Area • Over 250 distribution centers lie within the PRPA’s immediate hinterland 9
No Port Congestion Continues in Competing Ports • Less terminal congestion compared to other East Coast ports • Quicker ship and truck turn times 10
Rail Connections through Port Philadelphia 11
Global Leader in Food Imports #1 in USA for • Chilean Fruit • Cocoa Beans • Bananas • Australian Meat • New Zealand Dairy In 2015, Delaware River Ports • $2 Billion in Fruit Imports • $5 Billion in Food Imports 12
The Philadelphia Advantage Philadelphia New York Air draft of 188 ft (57.3 m) Air draft of 150 ft (45.7 m) (Bayonne Bridge) NYSA assessment – on average an additional charge of No assessment $100 per container 19 ILA start times 5 ILA start times 6.5 hours from sea buoy 4 hours from sea buoy No pension withdrawal liability Pension withdrawal liability Gross production of 32 moves an hour with individual Gross moves per hour typically less than Philadelphia vessel gross production reaching 40 moves an hour Truck turn time less than 1 hour due to lower density Truck turn time unfavorable due to high density operation operation and overall congestion 10 ILA holidays per year 16 ILA holidays per year 13
Temperature Controlled Storage Capacity • Over 365,973 sq. ft. of on-dock refrigerated warehouse capacity • 2,175,383 cu. ft. on-dock freezer warehouse located on Packer Avenue Marine Terminal • On-dock electrical outlets for perishables containers (known as “reefer plugs”) • 14 PRPA terminals have 2,000 reefer plugs
Packer Avenue Marine Terminal Demand Forecast Future capital needs for Packer Avenue Marine Terminal estimated at $136 - 15 $256 million. Discussions with the tenant and State are progressing.
Southport Marine Terminal Complex For information on the development of the future Southport Marine Terminal Complex, 16 go to – www.philaport.com/SouthportRFQ.html
Southport Marine Terminal Complex (Artist Rendering) (Left to Right) Container Terminal And Ancillary Logistics Port, CSX and Norfolk Southern Intermodal Yards, I-95 17
Carrier Services Smaller Ports; Specialized Services • New services connecting Port Philadelphia with Central America and Mexico. Maiden call of the new Mexican service commenced earlier this month. 6 days from Phila. to Verarcruz! 19
Thank You For r more in inform rmatio ion, contact PRPA Mark rketin ing at (215) 426- 2600 or r marketin ing@phil ilaport.com
Recommend
More recommend