
SLIDE 1
P a g e | 1
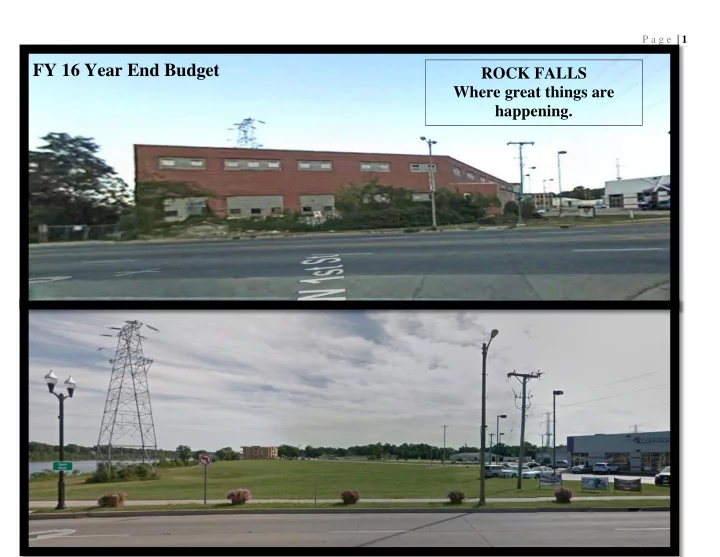
FY 16 Year End Budget
ROCK FALLS Where great things are happening.
P a g e | 2 City of Rock Falls Mayor William B. Wescott Council - - PowerPoint PPT Presentation
P a g e | 1 FY 16 Year End Budget ROCK FALLS Where great things are happening. P a g e | 2 City of Rock Falls Mayor William B. Wescott Council Members Ward 1 Ward 2 Ward 3 Ward 4 Daehle Reitzel Glen Kuhlemier James Schuneman Lee
P a g e | 1
FY 16 Year End Budget
ROCK FALLS Where great things are happening.
P a g e | 2
Mayor
William B. Wescott
Council Members
Ward 1 Ward 2 Ward 3 Ward 4
Daehle Reitzel Glen Kuhlemier James Schuneman Lee Folsom George Logan Brian Snow Rod Kleckler Troy Ebenezer
Clerk City Treasurer City Administrator
Eric Arduini Kay Abner Robbin Blackert
P a g e | 3
Contents
FY 16 General Fund Year End ........................................................................................................................................................................................... 4 General Fund Revenues & Assumption Outcomes: ....................................................................................................................................................... 4 5 Year Revenue Chart with one-time revenue sources 5 Year Revenue Chart of reoccurring revenue ................................................................... 4 General Fund Revenue Breakdown ................................................................................................................................................................................ 5 FY 16 General Fund Revenue Pie Chart......................................................................................................................................................................... 8 FY 16 General Fund Expenditures Year-End Summary .................................................................................................................................................... 9 General Fund Expenditures & Assumption Outcomes ................................................................................................................................................... 9 FY 16 General Fund Expenditure Breakdown.............................................................................................................................................................. 10 FY 16 General Fund Expenditures Pie Chart ............................................................................................................................................................... 11 FY 16 Utility/Enterprise Funds Year-End Summary........................................................................................................................................................ 12 FY 16 Year-End All Other Funds ..................................................................................................................................................................................... 13 FY 16 Complete Year-End Summary ............................................................................................................................................................................... 19
P a g e | 4
FY 16 General Fund Year End
General Fund Revenues & Assumption Outcomes:
The overall General Fund revenues for FY 16 greatly exceeding the budget expectations due to one time revenues totaling $2,706,484 from a debt certificate issuance and an inter-fund loan from the Electric Utility. Those revenues were used to purchase 97 acres of development land along the I-88 exchange along Route 40 (see page 9). The General Fund assumption for reoccurring revenue was actually $72,518 less than predicted. The deficit in revenues is most notable in receipt of anticipated grants funds for demolition of the limestone building. Since the demolition has not
Liquor License, Building Permits and Video Gaming exceeded assumptions. The charts below represent the General Fund revenue with the one time revenue sources for land acquisition and the reoccurring General Fund revenues. The figures in the charts below do not include the IMRF/SS revenues.
5 Year Revenue Chart with one-time revenue sources 5 Year Revenue Chart of reoccurring revenue
$- $1,000,000.00 $2,000,000.00 $3,000,000.00 $4,000,000.00 $5,000,000.00 $6,000,000.00 $7,000,000.00 $8,000,000.00 $9,000,000.00 $10,000,000.00 FY 13 FY 14 FY 15 FY 16 FY 17
Revenue
$5,000,000.00 $5,200,000.00 $5,400,000.00 $5,600,000.00 $5,800,000.00 $6,000,000.00 $6,200,000.00 $6,400,000.00 $6,600,000.00 $6,800,000.00 FY 13 FY 14 FY 15 FY 16 FY 17
Revenue
P a g e | 5
General Fund Revenue Breakdown
Revenue Account FY 2016
Descriptions Budget PROPERTY TAX REVENUE
1001-4000
$ 184,187.00 $ 183,514.56 4001
$ 45,000.00 $ 57,612.42 4002
$ 55,256.00 $ 55,054.30 4003
$ 55,256.00 $ 55,054.30 4004
$ 24,836.00 $ 24,811.30 4005 Prop Tax.-School Cross Gds $ 14,735.00 $ 14,680.69 4006
$ 281,064.00 $ 280,777.17 4010
$ 24,288.00 $ 24,297.78 18-18 4000 ESDA $ 2,316.00 $ 2,400.37 0808-4013
$ 139,669.57 $ 69,230.24 4408 Trans/Work Comp & Gen Liab $ 25,336.43 $ 165,544.60 4360 Rural Fire Protection Tax $ 130,000.00 $ 129,193.39 Property Tax Subtotal $ 981,944.00 $ 1,062,171.12
SALES TAX REVENUE
4309 State Sales Tax $ 1,090,939.00 $ 1,073,378.01 4307 Non-Home Rule Sales Tax $ 409,600.00 $ 615,387.67 4301 State Use Tax $ 179,760.40 $ 213,241.37 Non-Home Rule Sales Tax Transfers $ 295,400.00 $ - Sales Tax - Subtotal $ 2,292,516.46 $ 1,902,007.05
INCOME TAX REVENUE
4300 State Income Tax (LGDF) $ 917,334.00 $ 989,406.33 Income Tax - Subtotal $ 917,334.00 $ 989,406.33
FRANCHISE/USAGE/TAXES
4370 Comcast Franchise Fee $ 125,000.00 $ 128,125.31 4355 Simplified Tele. Maint. Fee $ 250,000.00 $ 194,713.62 4354 Natural Gas Utility Tax $ 115,000.00 $ 93,083.57 4371 Utility Service Partners Royalty $ 3,500.00 $ 3,713.89
P a g e | 6
10-12 4800 Wireless Tower Rental Fee $ 9,600.00 $ 11,933.98 4353 Nicor Franchise Fee $ 20,000.00 $ 15,797.60 65-65 Motor Fuel Tax Allotment & transfers $ 316,817.06 $ 237,835.19 4350 Street Maintenance-IDOT $ 19,000.00 $ 5,214.21 Franchise/Usage/Other Taxes $ 858,917.06 $ 447,367.97
UTILITY CONTRIBUTION
4143 Capital Cost Recovery $ 520,000.00 $ 480,648.28 4420 Rent - Utility Office $ 48,786.00 $ 48,792.00 4405 Cont Electric - Electric Usage $ 70,000.00 $ 72,054.40 4406 Cont Electric - Utility Tax $ - $ 1,831.32 4409 Cont Electric - Cap Cost $ 4,800.00 $ 4,009.04 4410 Cont Sewer - Sewer Usage $ 4,400.00 $ 4,596.67 4411 Cont Water - Water Usage $ 3,500.00 $ 3,786.14 4802 Contribution from Electric $ 5,000.00 $ 5,004.00 4803 Contribution from Water $ 37,000.00 $ 37,008.00 4804 Contribution from Sewer $ 37,000.00 $ 37,008.00 4805 Contribution from Garbage $ 65,000.00 $ 65,004.00
1002- 4802
Contribution Electric City Administrator $ 56,485.00
$ 56,796.00 1002- 4803
Contribution Water City Administrator $ 14,122.00
$ 14,124.00 1002- 4804
Contribution Sewer City Administrator
$ 14,122.00 $ 14,124.00 1002- 4805
Contribution Garbage City Adminis
$ 9,415.00 $ 9,420.00
4014 Tourism Rent $ - $ - 4015 Tourism Admin Fee $ 8,100.00 $ 8,828.00 Credit Card Convenience Fee $ 8,256.00 $ 198.00 Contribution from Utilities to GF
$ 905,986.00 $ 854,205.85 GRANTS
4012 Reimbursement-Grant Funds $ 280,000.00 $ 70,696.73 *4585 Police Grants $ 2,430.00 $ 823.22 *4585 Fire Grants $ 12,000.00 $ - Grants subtotal $ 294,430.00 $ 71,519.95
P a g e | 7
FIRE/POLICE REVENUE
*4293 Emergency Rescue $ 8,500.00 $ 11,556.75 *4294
Non Res. Emergency Response Fee$ 500.00 $ 1,448.95 *4295 Hazardous Chemical Release $ - $ - 1013-4700 Fire Chief Reimbursement $ 80,424.33 $ 80,233.33 40-40-4300 Video Gaming $ 90,000.00 $ 140,105.91 40-40-4700 Bail/Warrant Fee $ 13,000.00 $ 13,325.00 4330 Fines $ 62,000.00 $ 86,491.72 4335 Police Reports $ 1,500.00 $ 1,062.82 10-07 Code Hearing Income $ 23,280.00 $ 41,349.73 10-06-4371 Charitable Games $ 2,500.00 $ - 4400 Sex Offender Registration $ 1,050.00 $ 3,500.00 Fire/Police subtotal $ 282,754.33 $ 379,074.21
LICENSE/PERMITS/FEES
4310 Liquor Licenses $ 38,000.00 $ 88,300.00 4311 Tobacco/Liq. Violation Fines $ 500.00 $ 900.00 4315 Electric/Drain Layers Lic. $ 200.00 $ - 4329 Other Licenses $ 7,000.00 $ 14,045.00 4340 Building Permits $ 20,000.00 $ 30,719.28 1004-4350 Inspection Fees $ 12,000.00 $ 11,970.00 4345 Contractors Registration $ 5,000.00 $ 13,800.00 4346 Electrical Business License $ 175.00 $ - License/Permits/Fees Subtotal $ 82,875.00 $ 159,734.28
MISCELLANEOUS
4040 Interest/Investments $ 5,000.00 $ 4,245.72 4380 Sale of Junk $ 1,000.00 $ - 4800 Miscellaneous / fund transfers/RLF $ 30,000.00 $ 98,933.63 $ 519,698.03 Miscellaneous Subtotal $ 36,000.00 $ 622,877.38
Totals $ 6,335,939.79 $ 6,488,364.14
P a g e | 8
FY 16 General Fund Revenue Pie Chart
Sales Tax 29% Property Tax 16% Income Tax 15% Utility Contribution 13% Franchise/Usage 7% License/Fees 3% Police& Fire 6% Grant Funds 1% Miscellaneous 10%
Sales Tax Property Tax Income Tax Utility Contribution Franchise/Usage License/Fees Police& Fire Grant Funds Miscellaneous
P a g e | 9
FY 16 General Fund Expenditures Year-End Summary
General Fund Expenditures & Assumption Outcomes
The FY 16 General Fund realized a substantial increase in expected expenditures however, those expenditures were due to 97 acres of development land purchased by the City. These land purchases are represented in the Administration budget at $559,000 for the purchase of land from George and Jan Hallman in December 2015 and the April 2016 purchase from Wayne Schmitt and the remainder of acreage from Hallmans in the Public Property budget totaling $1,046,211 and 1,449,041, respectively. Several of the Departments came in under budget, however, the Street and Police Departments, which are two of the General Fund’s largest budgets, finished off the year significantly under
reflected in the FY 17 expenditures. Also due to the mild winter, the minimum amount of salt was ordered and extra funds were not required from Motor Fuel Tax. There are no
Fund.
P a g e | 10
FY 16 General Fund Expenditure Breakdown
General Fund FY 17 Budget FY 16 Budget FY 16 Actual FY 15 Budget FY 15 Actual Projected Revenue $ 6,690,542.27 $ 6,335,939.79 $ 8,969,906.17 $ 6,286,382.00 $ 6,268,609.72
Other Financing Sources $ - $ - $
$ 205,300.00 $ 205,930.00 $ 224,942.41 $ 195,902.00 $ 209,527.69 Revenue Totals $ 6,895,842.27 $ 6,541,869.79 $ 9,194,848.58 $ 6,482,284.00 $ 6,478,137.41 Department Expenses FY 16 Budget FY 16 Budget FY 16 Actual FY 15 Budget FY 15 Actual Administration $ 805,407.28 $ 897,001.89 $ 1,204,324.44 $ 1,121,176.00 $ 1,030,088.44 Building Dept. $ 173,090.82 $ 174,510.34 $ 167,908.84 $ 191,997.00 $ 180,295.54 City Administrator $ 92,926.00 $ 94,140.50 $ 91,199.96 $ 89,555.00 $ 92,588.96 City Clerk $ 180,541.60 $ 167,570.31 $ 171,608.25 $ 166,528.00 $ 168,466.24 Code Hearing Dept. $ 23,500.00 $ 22,400.00 $ 16,129.81 $ 20,950.00 $ 17,565.65 ESDA $ 2,000.00 $ 2,317.00 $ 422.10 $ 2,000.00 $ - Fire Dept. $ 1,089,575.94 $ 1,056,465.75 $ 1,119,678.73 $ 1,097,886.00 $ 1,233,334.81 Planning & Zoning $ 1,875.00 $ 2,375.00 $ 508.41 $ 2,250.00 $ 644.02 Police Dept. $ 2,381,998.84 $ 2,290,227.04 $ 2,178,262.69 $ 2,271,839.00 $ 2,154,785.05 Police/Fire Commission $ 12,395.00 $ 12,250.00 $ 10,429.78 $ - $ - Public Property $ 205,650.00 $ 48,050.00 $ 2,628,026.57 $ 113,552.98 $ 113,552.98 Street Dept. $ 1,713,239.57 $ 1,587,870.06 $ 1,304,521.11 $ 1,192,113.63 $ 1,137,716.71 Sub-Total Expenses $ 6,682,200.06 $ 6,355,177.89 $ 8,893,020.69 $ 6,269,847.61 $ 6,129,038.40 IMRF/Social Sec. $ 186,565.23 $ 180,848.25 $ 182,364.75 $ 190,531.00 $ 183,679.89 GF Utility Offset $ 86,277.57 $ 88,807.99 Expense Total $ 6,868,765.29 $ 6,536,026.14 $ 9,161,663.01 $ 6,460,378.61 $ 6,401,526.28 Surplus/(Deficit) $ 27,076.98 $ 5,843.65 $ 33,185.57 $ 21,905.39 $ 76,611.13 Reserve Balance Due $ 700,545.21
P a g e | 11
FY 16 General Fund Expenditures Pie Chart
Administration 13% Building Dept. 2% City Admininistrator 1% City Clerk 2% Code Hearing Dept. 0% ESDA 0% Fire Dept. 12% Planning & Zoning 0% Police Dept. 24% P/F Commission 0% Public Property 29% Street Dept.… IMRF/SS 2% Administration Building Dept. City Admininistrator City Clerk Code Hearing Dept. ESDA Fire Dept. Planning & Zoning Police Dept. P/F Commission Public Property Street Dept. IMRF/SS
P a g e | 12
FY 16 Utility/Enterprise Funds Year-End Summary
ELECTRIC UTILITY: The Rock Falls Electric Utility assumptions for both revenue and expenditures proved true. The revenues were slightly higher than assumed and expenditures were $320,000 less. The overall Operations and Maintenance (O & M) realized a $1 million profit which is $200,000 higher than budgeted. Any profit from O & M is used for capital improvements to the electric infrastructure. Capital improvements were made for the following line items: system upgrades, substations upgrades, generators, hydroelectric generation facility, equipment and the SCADA system. The electric utility’s anticipated rate study in FY 16 was delayed and will be completed in FY 17. Until the rate study has been completed and presented to the City Council, no changes have occurred in the electric rate. The hydroelectric generation facility located at the upper dam has operated at record levels and generated over 1 million kilowatt hours (kWh) multiple months during the past fiscal year. The total hydroelectric generation credit earned by our facility was $825,000 in FY 16. Capital Cost Recovery funds from electric usage contributed $480,000 to the General Fund. WASTEWATER The FY 16 year-end figures reflects no unpredicted outcomes to wastewater’s income in any category: O & M, Capital or Debt. However, there is $815,000 in one-time revenue received from Willett Hofmann & Associates. Due to an issue at the main lift station, and a sanitary sewer collapse
for 24-hour bypass pumping on West 1st Street. With these additional expenses, the Wastewater Department realized a $202,000 deficit in
M budget, the operational number of employees was reduced from 5 to 4, with the fifth employee being transferred to the Water Department to fill their vacant position. The Wastewater Department is conducting a rate study during FY 17 which may result in changes to the basic rate structure of the utilities in future years. WATER The Water Department had no unexpected change in revenue in O &M, Capital or Debt. The water revenue has held steady over the past several years and has maintained a modest operational profit. The Water Department is conducting a rate study in FY 17 in conjunction with the Wastewater Department which could possibly lead to increased revenues in future years. With the Well #7 project not proceeding on the anticipated time schedule in FY 16, the capital expenditures were half the amount budgeted however, those expenditures will be realized in FY 17. Capital improvements to the water plant and distribution system are continually
P a g e | 13
to the Water Department revenue and expenditures. GARBAGE Since changing the garbage collection process and entering into a new contract for waste disposal, the Garbage fund has seen a drastic change in its financial position. In 2012, the garbage fund was expected to use the last of its reserves and was showing significant losses each year. To date, the Garbage fund has regained a reserve balance exceeding $300,000. There were no significant variances from the forecasted budget for either revenues
FY 16 Year-End All Other Funds
Tourism Fund FY 16 Budget FY 16 Actual FY 15 Budget FY 15 Actual Revenues $ 162,000.00 $ 805,522.49 $ - $ 93,723.24 Reserves $ - $ - $ - $ - Total Income $ 162,000.00 $ 805,522.49 $ - $ 93,723.24 Expenses
$ 15,900.00 $ 119,356.02 $ - $ 35,078.36
Trans to (from) Reser $ 146,100.00 $ 686,166.47 $ - $ 58,644.88 Total Expenses $ 162,000.00 $ 805,522.49 $ - $ 93,723.24 Demolition Fund FY 16 Budget FY 16 Actual FY 15 Budget FY 15 Actual Revenues $ 5,060.00 $ 14,945.43 $ - $ 26,840.62 Reserves $ - $ - $ - $ - Total Income $ 5,060.00 $ 14,945.43 $ - $ 26,840.62 Expenses
$ 48,000.00 $ 14,945.43 $ - $ 10,939.89
Trans to (from) Reser $ (42,940.00) $ - $ - $ 15,900.73 Total Expenses $ 5,060.00 $ 14,945.43 $ - $ 26,840.62
P a g e | 14
Broadband Fund FY 16 Budget FY 16 Actual FY 15 Budget FY 15 Actual Revenues $ 32,068.80 $ 31,738.54 $ 23,800.00 $ 394,926.51 Transfer in from Reserves $ - $ - $ - $ - Total Income $ 32,068.80 $ 31,738.54 $ 23,800.00 $ 394,926.51
$ 93,357.20 $ 77,541.88 $ 24,857.00 $ 241,231.21
Trans to(from) Reserves
$ (61,288.40) $ (45,803.34) $ (1,057.00) $ 153,695.30 Total Expenses $ 32,068.80 $ 31,738.54 $ 23,800.00 $ 394,926.51 Electric Department Note: Revenues are total billed in budget, not actual received. FY 16 FY 16 Actual FY 15 FY 15 Actual Revenues $ 9,773,416.91 $ 9,764,811.23 $ 9,776,658.00 $ 9,686,730.73 Transfer from Reserves $ - $ - $ - $ - Total Income $ 9,773,416.91 $ 9,764,811.23 $ 9,776,658.00 $ 9,686,730.73 Expenses $ 8,970,271.89 $ 8,649,075.41 $ 9,060,078.00 $ 8,368,409.36 Capital Projects $ 802,446.00 $ 1,033,839.39 $ 897,500.00 $ 1,037,724.46 Total Expenses $ 9,772,717.89 $ 9,682,914.80 $ 9,957,578.00 $ 9,406,133.82 Transfer to Reserves $ 699.02 $ 81,896.43 $ (180,920.00) $ 280,596.91
P a g e | 15
Garbage Department Note: Revenues are total billed in budget, not actual received, actual numbers are shown on previous budget years FY 16 Budget FY 16 Actual FY 15 Budget FY 15 Actual Revenues $ 603,960.00 $ 602,329.92 $ 603,960.00 $ 601,872.91
Transfer from Reserves
Transfer in from Reserves $ - $ - $ - $ - Total Income $ 603,960.00 $ 602,329.92 $ 603,960.00 $ 601,872.91 Expenses $ 501,229.00 $ 496,574.76 $ 491,531.00 $ 481,433.10 Transfer to Reserve $ 102,731.00 $ 105,755.16 $ 112,429.00 $ 120,439.81 Total Expense $ 603,960.00 $ 602,329.92 $ 603,960.00 $ 601,872.91 GIS/IT Technician GIS/IT technician position that will be funded from departments as needed. FY 16 Budget FY 16 Actual FY 15 Budget FY 15 Actual Total Income $ 90,995.00 $ 91,020.00 $ 114,063.00 $ 114,055.28 Total Expenses $ 90,995.00 $ 68,956.66 $ 114,063.00 $ 50,625.41 $ 22,063.34 $ 63,429.87 Industrial Development Commission (IDC) FY 16 Budget FY 16 Actual FY 15 Budget FY 15 Actual Revenues $ 11,407.25 $ 6,651.76 $ 11,558.00 $ 11,485.18
Transfer from Reserves
$ 5,368.75 $ - $ - $ - Total Income $ 16,776.00 $ 6,651.76 $ 11,558.00 $ 11,485.18 Expenditures $ 16,776.00 $ 15,332.58 $ 16,776.00 $ 13,006.14
Trans to/(from) Reserve
$ (5,368.75) $ (8,680.82) $ (5,218.00) $ (1,520.96)
P a g e | 16
Sewer Department Note: Revenues are total billed in budget, not actual received FY 16 Budget FY 16 Actual FY 15 Budget FY 15 Actual O&M revenues $ 1,279,000.00 $ 1,813,923.62 $ 1,276,200.00 $ 1,270,866.47 Transfer from Reserves $ 121,864.82 $ - $ - $ - Total O&M Income $ 1,400,864.82 $ 1,813,923.62 $ 1,276,200.00 $ 1,270,866.47 O& M Expenses $ 1,400,864.82 $ 2,016,069.85 $ 1,316,562.00 $ 1,570,908.00 to Reserves $ - $ (202,146.23) $ (40,362.00) $ (300,041.53) Total O&M Expenses $ 1,400,864.82 $ 1,813,923.62 $ 1,276,200.00 $ 1,270,866.47 Capital Improvement Income $ 120,960.00 $ 127,968.70 $ 120,960.00 $ 126,424.55 Transfer from Reserves $ 34,835.00 $ - $ - $ - Total Capital Income $ 155,795.00 $ 127,968.70 $ 120,960.00 $ 126,424.55 Capital Exp. $ 155,795.00 $ 122,768.24 $ 705,795.00 $ 81,786.91 Transfer to Reserves $ - $ 5,200.46 $ (584,835.00) $ 44,637.64 Total Capital Imp. Exp. $ 155,795.00 $ 127,968.70 $ 120,960.00 $ 126,424.55 Total Debt Service Exp. $ - $ - $ - $ - Plant Rep Income $ 1,285,200.00 $ 1,483,408.98 $ 1,285,200.00 $ 1,489,798.65 Transfer from Reserves $ - $ - $ - $ - Total Income $ 1,285,200.00 $ 1,483,408.98 $ 1,285,200.00 $ 1,489,798.65 Plant Rep Exp $ 1,008,063.06 $ 1,008,063.06 $ 1,029,314.00 $ 1,022,518.06 Transfer to Reserves $ 277,136.94 $ 475,345.92 $ 255,886.00 $ 467,280.59 Plant Expense $ 1,285,200.00 $ 1,483,408.98 $ 1,285,200.00 $ 1,489,798.65
P a g e | 17
TIF-Riverfront Created 1994 FY 16 Budget FY 16 Actual FY 15 Budget FY 15 Actual Revenues $ 36,050.00 $ 34,672.49 $ 36,050.00 $ 39,347.61 Transfer in from Reserves $ - $ - $ - $ - Total Income $ 36,050.00 $ 34,672.49 $ 36,050.00 $ 39,347.61 Total Expenses $ 37,600.00 $ 19,463.90 $ 37,600.00 $ 20,078.43 Transfer to Reserves $ (1,550.00) $ (1,550.00) Unexpended Funds $ - $ 15,208.59 $ - $ 19,269.18 TIF-Downtown Created 2010 FY 16 Budget FY 16 Actual FY 15 Budget FY 15 Actual Revenues $ 201,500.00 $ 6,839.30 $ 1,500.00 $ 566.54 Transfer in from Reserves $ - $ - $ - $ 136,918.92 Total Income $ 201,500.00 $ 6,839.30 $ 1,500.00 $ 137,485.46 Total Expenses $ 200,000.00 $ 39,138.40 $ 1,000.00 $ 137,485.46 Transfer to Reserves $ 1,500.00 $ (32,299.10) $ 500.00 $ 0.00 Unexpended Funds $ - $ - $ - $ - Utility Office Note: Any unencumbered money in this fund is returned to the funding utility funds, hence they have no carryover. FY 16 Budget FY 16 Actual FY 15 Budget FY 15 Actual Revenues $ 435,043.58 $ 434,657.00 $ 446,019.00 $ 449,115.90 Expenditures $ 435,043.58 $ 392,912.45 $ 446,019.00 $ 394,270.23 Unexpended Funds $ - $ 41,744.55 $ - $ 54,845.67
P a g e | 18
Water Department Note: Revenues are total billed in budget, not actual received FY 16 Budget FY 16 Budget FY 15 Budget FY 15 Actual O&M revenues $ 1,163,511.63 $ 1,332,815.82 $ 1,142,207.00 $ 1,190,063.02
Transfer from Reserves
$ - $ - Total O&M Income $ 1,163,511.63 $ 1,332,815.82 $ 1,142,207.00 $ 1,190,063.02 O& M Expenses $ 1,133,419.13 $ 1,326,577.38 $ 1,036,322.00 $ 1,048,444.07 Transfer to Reserves $ 30,092.50 $ 6,238.44 $ 105,885.00 $ 141,618.95 Total O&M Expenses $ 1,163,511.63 $ 1,332,815.82 $ 1,142,207.00 $ 1,190,063.02 Capital Imp. Income $ 130,204.80 $ 131,115.88 $ 125,000.00 $ 129,500.49 Transfer from reserve $ 90,295.20 $ - $ - Total Capital Income $ 220,500.00 $ 131,115.88 $ 125,000.00 $ 129,500.49 Total Cap Expense $ 220,500.00 $ 95,506.52 $ 577,500.00 $ 384,781.25 Transfer to reserve $ - $ 35,609.36 $ (452,500.00) $ (255,280.76) Total Capital Expenses $ 220,500.00 $ 131,115.88 $ 125,000.00 $ 129,500.49 Debt Service Income $ 263,122.20 $ 264,792.28 $ 252,000.00 $ 217,410.14 To/(from) Reserves $ - $ - Total Debt Service Inc. $ 263,122.20 $ 264,792.28 $ 252,000.00 $ 261,655.58 Debt Service Expenses $ 231,865.52 $ 154,183.68 $ 172,000.00 $ 171,044.68 Transfer to Reserves $ 31,256.68 $ 110,608.60 $ 80,000.00 $ 90,610.90 Total Debt Service Exp $ 263,122.20 $ 264,792.28 $ 252,000.00 $ 261,655.58
P a g e | 19
FY 16 Complete Year-End Summary
Due to expenditures exceeding the budget assumptions, the City filed an amended appropriation ordinance in FY 16 to cover the additional amount. Although we had many unplanned expenditures, the City ended the year strong with a surplus balance of $33,185.57 slightly above the anticipated figure of $5,843.65. All reserve funds are safely above the required reserve balances. The City’s fiscal health is stable and we are looking forward to the State of Illinois passing their FY 16 and FY 17 budgets so that we may be able to have a clear picture of what, if anything, may need to be adjusted in our municipal finances.
Total of All funds combined
Note: Utility Office & GIS/IT is not part of this total as this as costs are already calculated into the various utility fund expenses and General Fund.
FY 16 Budget FY 16 Actual FY 15 Budget FY 15 Actual Total Revenues $ 22,387,733.73 $ 25,477,030.39 $ 21,697,459.00 $ 22,502,029.61 Total Expenditures $ 22,381,890.08 $ 25,443,844.82 $ 21,675,553.61 $ 22,425,418.48 Surplus/(Deficit) Budget $ 5,843.65 $ 33,185.57 $ 21,905.39 $ 76,611.13