
SLIDE 1
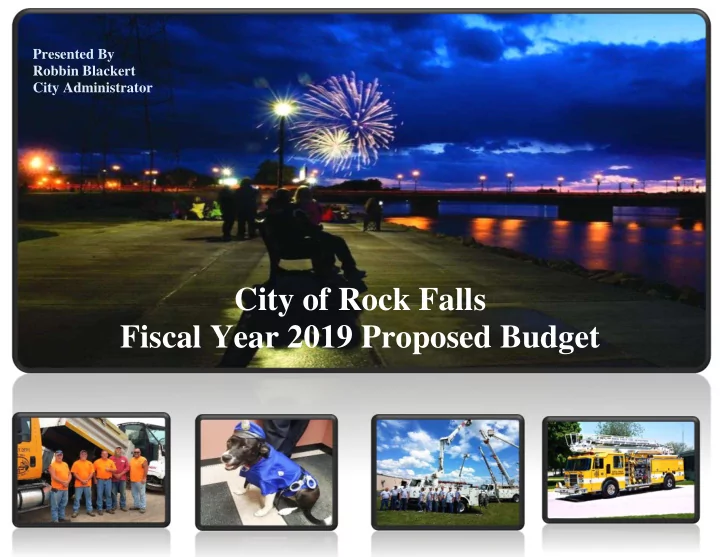
Presented By Robbin Blackert City Administrator
City of Rock Falls Fiscal Year 2019 Proposed Budget
City of Rock Falls Fiscal Year 2019 Proposed Budget P a g e | 1 - - PowerPoint PPT Presentation
Presented By Robbin Blackert City Administrator City of Rock Falls Fiscal Year 2019 Proposed Budget P a g e | 1 City of Rock Falls Mayor William B. Wescott Council Members Ward 1 Ward 2 Ward 3 Ward 4 Daehle Reitzel Glen Kuhlemier
Presented By Robbin Blackert City Administrator
City of Rock Falls Fiscal Year 2019 Proposed Budget
P a g e | 1
Mayor
William B. Wescott
Council Members
Ward 1 Ward 2 Ward 3 Ward 4
Daehle Reitzel Glen Kuhlemier James Schuneman Lee Folsom George Logan Brian Snow Rod Kleckler Violet Sobottka
Clerk City Treasurer City Administrator
Eric Arduini Kay Abner Robbin Blackert
P a g e | 2
Contents
Rock Falls at a Glance ........................................................................................................................................................................................................ 3 “Our Future is Bright” .................................................................................................................................................................................................... 3 FY 19 General Fund Revenue Summary ............................................................................................................................................................................ 4 General Fund Revenues & Assumptions: ....................................................................................................................................................................... 4 Historical Revenue Chart ................................................................................................................................................................................................ 4 General Fund Revenue Breakdown ................................................................................................................................................................................ 5 FY 19 General Fund Revenue Pie Chart......................................................................................................................................................................... 7 FY 19 General Fund Expenditures Summary ..................................................................................................................................................................... 8 General Fund Expenditures & Assumptions ................................................................................................................................................................... 8 General Fund Expenditures FY 19 & FY 18 Comparison .............................................................................................................................................. 8 FY 19 General Fund Expenditures Pie Chart ................................................................................................................................................................. 9 FY 19 Utility/Enterprise Funds Summary ........................................................................................................................................................................ 10 Enterprise Expenditure/Revenue FY 19 & FY 18 Comparison.................................................................................................................................... 12 Enterprise Historical Revenue Summary ...................................................................................................................................................................... 13 FY 19 Total Government Funds Summary ....................................................................................................................................................................... 14 General Fund ................................................................................................................................................................................................................. 14 Enterprise and Other Stand Alone Funds...................................................................................................................................................................... 15
P a g e | 3
Rock Falls at a Glance
“Our Future is Bright”
Last year the City of Rock Falls and its residents celebrated our Sesquicentennial marking 150 years on the south bank of the Rock River, continuing the legacy of our founder A.P. Smith in 1867. While it was an opportunity to look back at our history, it also provided us the chance to stop, look and set a vision for our future. Over the past 3 years, the City has worked very hard to cultivate and take the necessary steps to plant the seed that will provide a bounty in the years to come. We purchased land on the I-88 corridor to allow us to begin the process of economic development opportunities on the south end of town. In addition, we have seen the Brownfields project on the RB&W properties completed and have seen the riverfront area rejuvenated and come alive with the completion of the Holiday Inn & Suites Hotel, as well as, the dedication of the RB&W Riverfront
to our uptown businesses as well. We continue to work on other riverfront properties that will allow us to extend the beauty of the riverfront and make it a truly vibrant destination and improve the quality
businesses at the same time. One of the keys to our future development is our stable financial position and the operational successes of our utilities; electric, water, wastewater and taking us into the technology age out latest utility, Rock Falls FiberNet. Rock Falls with a population of 9200 located in Northwest Illinois will become one of only 100 cities in the United States to claim the title of “Gigabit City”. Before us stands unlimited opportunities and, as we have in the past, we will rise up and meet the challenges to provide our residents and businesses with continued opportunities for staking their claim to the future growth of our community. Are you looking for a fresh start, let your journey begin in Rock Falls at the “Urban Crossroads: Where City Life and Nature Meet”. Mayor William B. Wescott
P a g e | 4
FY 19 General Fund Revenue Summary
General Fund Revenues & Assumptions:
The General Fund assumption for the reoccurring revenue sources with slight growth in some revenue sources, a slight decline in other sources and stagnation in others. The FY 19 budget predicts an increase in all general fund revenues, including non-reoccurring revenues by 26.16% over FY 18 all general fund reoccurring revenues at 8.65% of FY 18. The non-reoccurring revenues include the assumption of $1.2M in USEPA and ILEPA grants and revolving loan funds, respectively. Certain revenue assumptions are made based on historical data and formulas as supplied by the Illinois Municipal League for calculating Motor Fuel Tax, State Use Tax and State Income Tax (LGDF). The 2% administration fee for the Non Home Rule Tax is assumed showing a decrease of over $26,000 to that revenue stream. Another decrease in revenue is expected in the State Income Tax (LGDF). The FY 18 assumption was $101.00 per capita which was considerably higher than the FY 19 assumption of $95.80 per capita which could result in a $48,000 loss of revenue. One significant increase in revenue is the $100,000 Rural Fire Protection District increase over past years due to an increased property tax assessment to rural residents. The tax levy for the upcoming fiscal year held at a 4.99% increase over the past year and will result in an $8.38 increase to the average homeowner in Rock Falls. Contributions to the general fund by the utilities are 10% of the total revenues which is down from FY 18’s contribution level of 13%. Below is a chart representing the past seven years of general fund revenues.
Historical Revenue Chart
$- $1,000,000.00 $2,000,000.00 $3,000,000.00 $4,000,000.00 $5,000,000.00 $6,000,000.00 $7,000,000.00 $8,000,000.00 $9,000,000.00 $10,000,000.00 FY 13 FY 14 FY 15 FY 16 FY 17 FY 18 FY 19
Revenue
P a g e | 5
General Fund Revenue Breakdown
SALES TAX REVENUE
State Sales Tax
$ 1,090,000.00
Non-Home Rule Sales Tax
$ 791,840.00
State Use Tax
$ 243,695.00
Non-Home Rule Sales Tax Transfers
$ -
Sales Tax - Subtotal
$ 2,595,373.00
INCOME TAX REVENUE
State Income Tax (LGDF)
$ 887,682.00
Income Tax - Subtotal
$ 887,682.00
PROPERTY TAX REVENUE
$ 184,484.00
$ 57,000.00
$ 55,345.00
$ 55,345.00
$
Prop Tax.-School Cross Gds
$ -
$ 457,752.00
$
ESDA
$ 208,248.00
Trans/Work Comp & Gen Liab
$ 208,000.00
Rural Fire Protection Tax
$ 230,000.00
Property Tax Subtotal
$ 1,456,174.00
FIRE/POLICE REVENUE
Emergency Rescue
$ 8,500.00
Non Res. Emergency Response Fee
$ 500.00
Hazardous Chemical Release
$ -
Fire Chief Reimbursement
$ 90,742.00
Video Gaming
$ 180,000.00
Bail/Warrant Fee
$ 13,000.00
Fines
$ 62,000.00
Police Reports
$ 1,500.00
Code Hearing Income
$ 37,420.00
Charitable Games
$ 2,500.00
Sex Offender Registration
$ 2,000.00
Fire/Police subtotal
$ 398,162.00
FRANCHISE/USAGE/TAXES
Comcast Franchise Fee
$ 130,000.00
Simplified Tele. Maint. Fee
$ 175,000.00
Natural Gas Utility Tax
$ 115,000.00
Utility Service Partners Royalty
$ 4,000.00
Wireless Tower Rental Fee
$ 10,000.00
Nicor Franchise Fee
$ 15,900.00
Motor Fuel Tax Allotment & transfers
$ 281,936.00
Street Maintenance-IDOT
$ 19,000.00
Franchise/Usage/Other Taxes
$ 750,836.00
P a g e | 6
LICENSE/PERMITS/FEES
Liquor Licenses
$ 38,000.00
Tobacco/Liq. Violation Fines
$ 500.00
Electric/Drain Layers Lic.
$ -
Other Licenses
$ 7,000.00
Building Permits
$ 25,000.00
Inspection Fees
$ 12,000.00
Contractors Registration
$ 10,000.00
Electrical Business License
$ -
License/Permits/Fees Subtotal
$ 92,500.00
GRANTS
Reimbursement-Grant Funds
$ 1,200,000.00
Police Grants
$ 2,500.00
Fire Grants
$ -
Grants subtotal
$ 1,202,500.00
UTILITY CONTRIBUTION
Capital Cost Recovery
$ 490,000.00
Rent - Utility Office
$ 48,786.00
Cont Electric - Electric Usage
$ 70,000.00
Cont Electric - Utility Tax
$ -
Cont Electric - Cap Cost
$ 4,800.00
Cont Sewer - Sewer Usage
$ 4,400.00
Cont Water - Water Usage
$ 3,500.00
Contribution from Electric
$ 5,000.00
Contribution from Water
$ 37,000.00
Contribution from Sewer
$ 37,000.00
Contribution from Garbage
$ 65,000.00
Contribution Electric City Administrator
$ 74,986.00
Contribution Water City Administrator
$ 18,747.00
Contribution Sewer City Administrator
$ 18,747.00
Contribution Garbage City Adminis
$ 12,498.00
Tourism Rent
$ 12,000.00
Tourism Admin Fee
$ 8,100.00
Credit Card Convenience Fee
$
Contribution from Utilities to General Fund
$ 910,564.00 MISCELLANEOUS
Interest/Investments
$
Sale of Junk
$ 500.00
Miscellaneous / fund transfers
$ 335,549.47
Miscellaneous Subtotal
$ 351353.47
Totals
$ 8,645,667.47
P a g e | 7
FY 19 General Fund Revenue Pie Chart
Sales Tax 30% Property Tax 17% Income Tax 10% Utility Contribution 10% Franchise/Usage 9% License/Fees 1% Police& Fire 5% Grant Funds 14% Miscellaneous 4%
FY 19 Revenue
Sales Tax Property Tax Income Tax Utility Contribution Franchise/Usage License/Fees Police& Fire Grant Funds Miscellaneous
P a g e | 8
FY 19 General Fund Expenditures Summary
General Fund Expenditures & Assumptions
The FY 19 General Fund assumes increased expenditures over FY 18 by 25.44%. However, without the $1.2M in non-reoccurring expenditures for the Limestone & Parrish Alford Brownfields sites, the increase would be 7.96% over FY 18. The most notable increase, other than non-reoccurring Brownfield expenditures in Public Property is in the Street Department budget for repaving of South 14th Avenue (Buell Road) and rebuilding a portion
revenues of 26.16%. As in the past the three largest general fund budgets are the Police, Street & Fire Departments.
General Fund Expenditures FY 19 & FY 18 Comparison
Budget Year FY 19 FY 18
Over/Under FY 18 Administration $ 619,312.00 $ 747,883.00
Building Dept. $ 242,864.13 $ 185,766.00
30.74%
City Administrator $ 129,140.00 $ 98,505.00
31.10%
City Clerk $ 218,354.95 $ 200,418.00
8.95%
Code Hearing Dept. $ 23,900.00 $ 26,700.00
ESDA $ 1,000.00 $ 1,000.00
0.00%
Fire Dept. $ 1,310,432.00 $ 1,211,880.00
8.13%
Planning & Zoning $ 3,875.00 $ 3,875.00
0.00%
Police Dept. $ 2,805,335.17 $ 2,693,978.00
4.13%
P/F Commission $ 21,901.00 $ 12,345.00
77.41%
Public Property $ 1,237,200.00 $ 201,650.00
513.54%
Street Dept. $ 2,072,383.00 $ 1,496,596.00
38.47%
IMRF/SS $ 173,877.03 $ 182,157.00
$ 8,840,818.28 $ 7,062,753.00 25.44%
P a g e | 9
FY 19 General Fund Expenditures Pie Chart
Administration, 7% Building Dept., 3% City Admininistrator, 1% City Clerk , 3% Code Hearing Dept., 0% ESDA, 0% Fire Dept., 15% Planning & Zoning, 0% Police Dept., 32% P/F Commission, 0% Public Property, 14% Street Dept., 23% IMRF/SS, 2%
FY 19 Expenditures
Administration Building Dept. City Admininistrator City Clerk Code Hearing Dept. ESDA Fire Dept. Planning & Zoning Police Dept. P/F Commission Public Property Street Dept. IMRF/SS
P a g e | 10
FY 19 Utility/Enterprise Funds Summary
ELECTRIC UTILITY: The Rock Falls Electric Utility is an RP3 (Reliable Public Power Provider) City through the American Public Power Association. The RP3 program recognizes utilities that demonstrate high proficiency in reliability, safety, work force development and system improvement. Criteria within each of the four RP3 areas are based upon sound business practices and recognized industry leading practices. The Electric Department budget includes a large capital project for the $9M rebuild of the Avenue A Substation. The funding for this capital project will come for the issuance of Alternate Revenue Source bonds. The revenue and expenditure assumptions for the utility are inclusive of both the bond funds and the cost of the rebuild. There are no other significant changes to the operation & maintenance or capital budgets of the electric utility. The hydroelectric generation facility located at the upper dam has operated at record levels and generated over 1 million kilowatt hours (kWh) multiple months during the past fiscal year. WASTEWATER The FY 19 Wastewater Department budget reflects a rate increase of 8.93% for basic residential wastewater customers. This increase is the result of a rate study completed in FY 18 and reflects a one-time adjustment to the rates with the next three fiscal years increasing at a lower 3.9%. The Wastewater Department Operations & Maintenance budget has no significant changes to revenues or expenditures however, the capital budget does include a project totaling $600,000. The project involves slip lining a 24 inch sanitary sewer line on West 1st Street, LeRoy Avenue & 8th
P a g e | 11 WATER The FY19 Water Department budget reflects a rate increase of 4.5% each year for the next four years for basic residential water customers. This increase is the result of a rate study completed in FY 18 for both the water & wastewater utilities. The Water Department Operations & Maintenance budget has no substantial changes to revenues
treatment plant facility. The increase in sewer and water rates will result in the basic residential customer having a total increase to their bill
GARBAGE Fiscal Year 18 marked the final year a multi-year contract with Moring Disposal for solid waste pick up within the City. The City has successfully negotiated a new seven year contract which will begin August 1, 2018. The contract will bring about a new era to the City where two 95 gallon toters will be provided to each of the residences, one for garbage and one for recyclables. Curbside garbage collection will continue on a weekly basis however, the recyclables will be picked up every other week. This contract will allow the City to continue to provide curbside pick up to the residents with no increase in rates scheduled until FY 21. There are no significant changes to the garbage fund’s budget for FY 19. BROADBAND/FIBER The newest of the City’s utilities, FIBERNET is rolling out in FY 19. Rock Falls FIBERNET is a Fiber to the Premise (FTTP) project whereby Rock Falls businesses and residents will have access to 1 Gigabit fiber internet service. The first construction phase consists of building out the backbone & business districts which began in FY 18 and is scheduled for completion in September of 2018. Rock Falls FIBERNET is going to deploy the Gigabit fiber to the premise project using the “Fiberhood” model. The service area is divided into 24 Fiberhoods with approximately 250 homes within each Fiberhood. When 45% of the residences within a Fiberhood have pre-subscribed for FIBERNET service, the City will complete the build out. FIBERNET will be available to residents within the City, and anyone who currently is a Rock Falls electric customer outside of the City Limits. The FY 19 budget for FIBERNET reflects the first year of operation with approximately $234,000 in operating revenue and $940,000 in operation and maintenance expenses. Once the system is build out in its entirety, the expecting annual operations and maintenance expenses are targeted at $1.3M with annual revenues of $2.6M. The FY 19 FIBERNET budget includes a capital budget representing the build out of the backbone and 3 Fiberhoods. The FY 19 capital budget is expected to be the highest year of capital expenditures if the broadband financial plan is followed at $3.7M.
P a g e | 12
Enterprise Expenditure/Revenue FY 19 & FY 18 Comparison
Non Reoccurring Non Reoccurring Reoccurring Reoccurring Expenditures FY 19 FY 18
Over/Under FY 18
FY 19
Over/Under FY 18
Electric $ 19,539,488.00 $ 9,177,232.00 112.91% $ 10,539,488.00 14.84% Wastewater $ 3,205,488.00 $ 2,782,006.00 15.22% $ 2,605,488.00
Water $ 1,514,677.00 $ 1,753,439.00
Broadband Fiber $ 4,889,321.00 $ - $ 1,200,000.00 Garbage $ 645,338.00 $ 547,106.00 17.95% $ 645,338.00 17.95% Revenue FY 19 FY 18
Over/Under FY18
FY 19
Over/Under FY 18
Electric $ 20,386,001.00 $ 9,265,024.00 120.03% $ 11,386,001.00 22.89% Wastewater $ 2,992,464.00 $ 2,671,200.00 12.03% $ 2,992,464.00 12.03% Water $ 1,660,839.00 $ 1,632,209.00 1.75% $ 1,642,839.00 0.65% Broadband Fiber $ 234,769.00 Garbage $ 604,260.00 $ 605,710.00
Includes total O&M, Capital & Debt for Expenditures & Revenue
P a g e | 13
Enterprise Historical Revenue Summary
FY 18 & FY 19 are budgeted figures and not actual final revenue $9,686,730.00 $9,764,811.00 $10,028,256.00 $9,265,024.00 $11,386,001.00 FY 15 FY 16 FY 17 FY 18 FY 19
ELECTRIC REVENUES
$1,190,063.02 $1,157,815.00 $1,183,320.00 $1,234,837.00 $1,205,389.00 FY 15 FY 16 FY 17 FY 18 FY 19
WATER REVENUES
$1,270,866.47 $1,288,923.00 $1,364,505.00 $1,259,000.00 $1,529,388.00 FY 15 FY 16 FY 17 FY 18 FY 19
SEWER REVENUES
P a g e | 14
FY 19 Total Government Funds Summary
General Fund
FY 19 Budget Projected Revenue $ 8,645,667.47
Other Financing Sources $ -
IMRF/SS Contribution $ 201,255.00 Revenue Totals $ 8,846,922.47 Department Expenses FY 19 Budget Administration $ 619,312.00 Building Dept. $ 242,864.13 City Administrator $ 129,140.00 City Clerk $ 218,354.95 Code Hearing Dept. $ 23,900.00 ESDA $ 1,000.00 Fire Dept. $ 1,310,432.00 Planning & Zoning $ 3,875.00 Police Dept. $ 2,805,335.17 Police/Fire Commission $ 21,901.00 Public Property $ 1,237,200.00 Street Dept. $ 2,072,383.00 Sub-Total Expenses $ 8,666,941.25 IMRF/Social Sec. $ 173,877.03 GF Utility Offset Expense Total $ 8,840,818.28 Surplus/(Deficit) $ 6,104.19
P a g e | 15
Enterprise and Other Stand Alone Funds
Broadband Demolition Electric Garbage Information Technology
FY 19 Budget Revenues $ 604,260.00
Transfer from Reserves
$ - Total Income $ 604,260.00 Expenses $ 645,338.00 Transfer to Reserve $ (41,078.00) Total Expense $ 604,260.00 FY 19 Budget Revenues $ 37,200.00 Reserves Total Income $ 37,200.00 Expenses
$ 49,500.00
Trans to (from) Reser $ (12,300.00) Total Expenses $ 37,200.00 FY 19 Revenues $ 20,386,000.69 Transfer from Reserves $ - Total Income $ 20,386,000.69 Expenses $ 9,579,375.05 Capital Projects $ 9,960,108.84 Total Expenses $ 19,539,487.89 Transfer to Reserves $ 846,512.80 FY 19 Budget Revenues $ 234,769.00 Transfer in from Reserves $ 4,654,552.21 Total Income $ 4,889,321.21
Expenses w/Capital
$ 4,889,321.21
Trans to(from) Reserves
$ - Total Expenses $ 4,889,321.21 FY 19 Budget Total Income $ 60,620.00 Total Expenses $ 60,620.00
P a g e | 16 Industrial Development Commission TIF- Downtown
FY 19 Budget Revenues $ 750,020.00
Transfer from Reserves
Total Income $ 750,020.00 Expenditures $ 712,700.00
Trans to/(from) Reserve
$ 37,320.00
TIF – Riverfront Tourism
FY 19 Budget Revenues $ 24,500.00 Transfer in from Reserves $ - Total Income $ 24,500.00 Total Expenses $ 24,500.00 Transfer to Reserves $ - Unexpended Funds
Utility Office
FY 19 Budget Revenues $ 491,163.00 Expenditures $ 491,163.00 Unexpended Funds $ - FY 19 Budget Revenues $ 879,900.00 Transfer in from Reserves $ - Total Income $ 879,900.00 Total Expenses $ 601,650.00 Transfer to Reserves $ 278,250.00 Unexpended Funds $ - FY 19 Budget Revenues $ 174,116.00 Reserves $ - Total Income $ 174,116.00 Expenses
$ 218,286.00
Trans to (from) Reser $ (44,170.00) Total Expenses $ 174,116.00
P a g e | 17 Water Wastewater
FY 19 Budget O&M revenues $ 1,529,388.10 Transfer from Reserves $ - Total O&M Income $ 1,529,388.10 O& M Expenses $ 1,448,425.33 to Reserves $ 80,962.77 Total O&M Expenses $ 1,529,388.10 Capital Improvement Income $ 177,876.00 Transfer from Reserves $ - Total Capital Income $ 177,876.00 Capital Exp. $ 749,000.00 Transfer to Reserves $ (571,124.00) Total Capital Imp. Exp. $ 177,876.00 Debt Service Income $ - Transfer from Reserves $ - Total Debt Service Inc. $ - Debt Service Expenses $ -
Transfer to (from) Reserves
$ - Total Debt Service Exp. $ - Plant Rep Income $ 1,285,200.00 Transfer from Reserves $ - Total Income $ 1,285,200.00 Plant Rep Exp $ 1,008,063.06 Transfer to Reserves $ 277,136.94 Plant Expense $ 1,285,200.00 FY 19 Budget O&M revenues $ 1,205,389.60
Transfer from Reserves
Total O&M Income $ 1,205,389.60 O& M Expenses $ 1,182,477.62 Transfer to Reserves $ 22,911.98 Total O&M Expenses $ 1,205,389.60 Capital Imp. Income $ 189,000.00 Transfer from reserve $ - Total Capital Income $ 189,000.00 Total Cap Expense $ 164,800.00 Transfer to reserve $ 24,200.00 Total Capital Expenses $ 189,000.00 Debt Service Income $ 266,450.25 To/(from) Reserves Total Debt Service Inc. $ 266,450.25 Debt Service Expenses $ 167,400.00 Transfer to Reserves $ 99,050.25 Total Debt Service Exp $ 266,450.25
P a g e | 18 The total budget sum of $41.79M represents a $15M or 36.32% increase over the FY 18’s budget. The Electric and Broadband/Fiber Departments have large non-reoccurring capital expenditures which have significantly skewed comparison over the past fiscal years. In addition to the Electric and Broadband/Fiber projects, several other City projects added to the variance. The following capital projects account for the $15M: $9.1M Electric Avenue A Substation rebuild; $3.7M Broadband/Fiber; $600K Wastewater Slip Lining Project $1.2M EPA projects for the P.A and Limestone Building sites. $500K Street South 14th Avenue (Buell Road) repaving and a portion of South 13th Avenue to be rebuilt. The FY 19 total operating budget expenditures for the City are $41,791,223.13 and assumes a $6,104.19 surplus. The surplus assumption is based on total operating revenues of $41,797,327.32. The FY 19 budget continues Rock Falls’ strong budgetary performance by maintaining reserve fund balances and excellent cash liquidity.
Fund Budgeted O & M Minimum Balance Days of O & M Per Day Cost General $ 8,666,941.25 $ 945,239.33 45 $ 21,005.32 Electric $ 9,579,379.05 $ 2,362,038.67 90 $ 26,244.87 Water $ 1,182,477.62 $ 583,139.65 180 $ 3,239.66 Sewer $ 1,529,388.10 $ 754,218.79 180 $ 4,190.10 Garbage $ 645,338.00 $ 318,248.88 180 $ 1,768.05
FY 19 Budget Total Revenues $ 41,797,327.32 Total Expenditures $ 41,791,223.13 Surplus/(Deficit) Budget $ 6,104.19