SLIDE 1
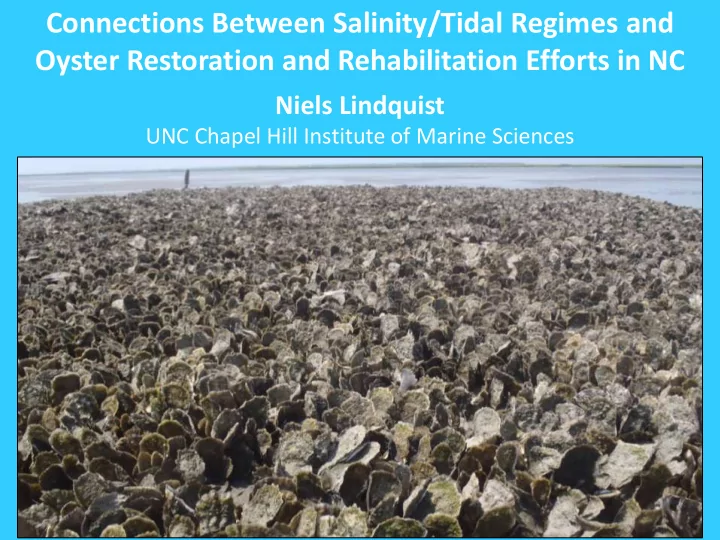
Connections Between Salinity/Tidal Regimes and Oyster Restoration and Rehabilitation Efforts in NC
Niels Lindquist
UNC Chapel Hill Institute of Marine Sciences
SLIDE 2
Required reading!
Winslow Grave Coker
SLIDE 3 river
inlet
Ridge et al. submitted (& recent editor rejection) L&O
SLIDE 4 river
inlet
Ridge et al. submitted (& recent editor rejection) L&O
SLIDE 5 1 2 3 4 5 6 7 8 9 10 5 10 15 20 25 30 35 40
Mean Station Salinity (ppt) Standard Deviation of Station Mean Salinity
NC DMF Shellfish Sanitation Station Data - 2007 to 2012 1230 stations, 30+ observations per stations
SLIDE 6 1 2 3 4 5 6 7 8 9 10 5 10 15 20 25 30 35 40
Mean Station Salinity (ppt) Standard Deviation of Station Mean Salinity intertidal reef areas building for the future subtidal reef areas
NC DMF Shellfish Sanitation Station Data - 2007 to 2012 1230 stations, 30+ observations per stations
SLIDE 7
SLIDE 8
SLIDE 9
Sanctuary
Mean Salinity SD Salinity Range % obs < 10 ppt % obs > 25 ppt
Ocracoke
24.5 5.6 10-38 50
Hatteras
21.7 4.8 10-35 31
West Bay
17.6 6.2 2-37 10 12
West Bluff
17.2 5.5 0-30 5 9
Gibb Shoal
16.9 5.1 0-30 6 7
Crab Hole
14.4 5.4 0-30 14 5
Middle Bay
14.1 4.8 1-31 17 1
Deep Bay
13.4 5.9 0-28 27 4
Neuse River
12.2 5.5 0-37 30 1
Croatan Sound
11.1 5.8 0-28 40 2
Pamlico Sound Oyster Sanctuary Salinity Characteristics
~1990-2012
SLIDE 10 2004 2006 2008 2009 2007 2012 2011 2010-s 2009
Year Planted Year Sampled
2010-f
5 10 15 20 5 10 15 20 5 10 15 20 5 10 15 20 5 10 15 20 5 10 15 20 5 10 15 20 5 10 15 20 5 10 15 20 5 10 15 20 5 10 15 20 5 10 15 20 5 10 15 20 5 10 15 20 5 10 15 20 5 10 15 20 5 10 15 20 5 10 15 20 5 10 15 20 5 10 15 20 5 10 15 20 5 10 15 20 5 10 15 20 5 10 15 20 5 10 15 20 5 10 15 20 5 10 15 20 5 10 15 20 5 10 15 20 5 10 15 20 5 10 15 20 5 10 15 20
Ocracoke
33 12 11 34 67 45 22 20 82 60 31 97 40 75 52 28
100% 100% 94% 100% 100% 89% 96% 100% 100%
# Individuals per rock
Shell Length (1-cm bins)
SLIDE 11
~3-4 years post deployment ~5-6 years post deployment ~6+ years post deployment
SLIDE 12
West Bluff western Pamlico Sound
SLIDE 13
dead for oysters struggling? maintaining
SLIDE 14
North River 2009 site North River 2010 site
SLIDE 15 10 20 30 40
50 100 150 200
10 20 30 40 50
50 100 150 200
N=131 98% of oysters infested N=180 92% of oysters infested 2009 site – no live oysters
Oyster Length (10-mm bins) Number of Individuals in each 10-mm size bin
Oyster size-frequency distributions on North River cultch plant sites.
recruitment failure?
2008 site 2006 site
SLIDE 16
SLIDE 17 +
Standard Deviation of Station Mean Station Mean Salinity (ppt)
0.0 1.0 2.0 3.0 4.0 5.0 6.0 7.0 8.0 9.0 10.0 15.0 20.0 25.0 30.0 35.0
1988-2012 data X X
West Bay Cedar Is. Bay NR–Stones Bay Newport River-SW Newport River-NE Nelson Bay Jarrett Bay Sleepy Creek North River NR–Sneads Ferry S
X NR-Inlet area
Chadwick Bay Alligator Bay Everett Bay Lea Is. marshes Figure 8 Is marshes Wrightsville channels Masonboro marshes Davis Creek area Shallotte River
SLIDE 18 5 10 15 20 25 30 35 40 23-Dec-88 15-Jun-94 06-Dec-99 28-May-05 18-Nov-10
Ocracoke
5 10 15 20 25 30 35 40 23-Dec-88 15-Jun-94 06-Dec-99 28-May-05 18-Nov-10
lower Neuse
Climate- Driven Shifts ...and Sea-Level Rise?
SLIDE 19
Winslow 1885-1886 Shellfish Sanitation 1988-2012
New River Core Sound
SLIDE 20
Adam Tyler David Cessna aka “Clammerhead”
SLIDE 21
Acknowledgements
NCDENR-DMF Shellfish Sanitation Patti Fowler Shannon Jenkins NCSU David Eggleston Robert Dunn UNC Undergraduates Amanda Karam Carmen Kuan Alex Hodges Andrea Hale NC Commercial Fishermen Adam Tyler David “Clammerhead” Cessna NC Division of Marine Fisheries Craig Hardy Pelle Holmlund Clay Caroon Mike Jordan Gretchen Lauriat Jer Hardin UNC Institute of Marine Sciences Joel Fodrie Tony Rodriguez Steve Fegley Abigail Poray Justin Ridge Sara Coleman Chris Baillie Alexia Pool Nate Geraldi Glenn Safrit Joe Purifoy Stacy Davis Eamon Kromka NCCR/NERRS John Fear University of Miami Patrick Nichols (undergrad) University of North Florida Katie Chellemi (undergrad)