
BIOMETHANE AS AN OPTION FOR ON-FARM ENERGY PRODUCTION
Norma McDonald
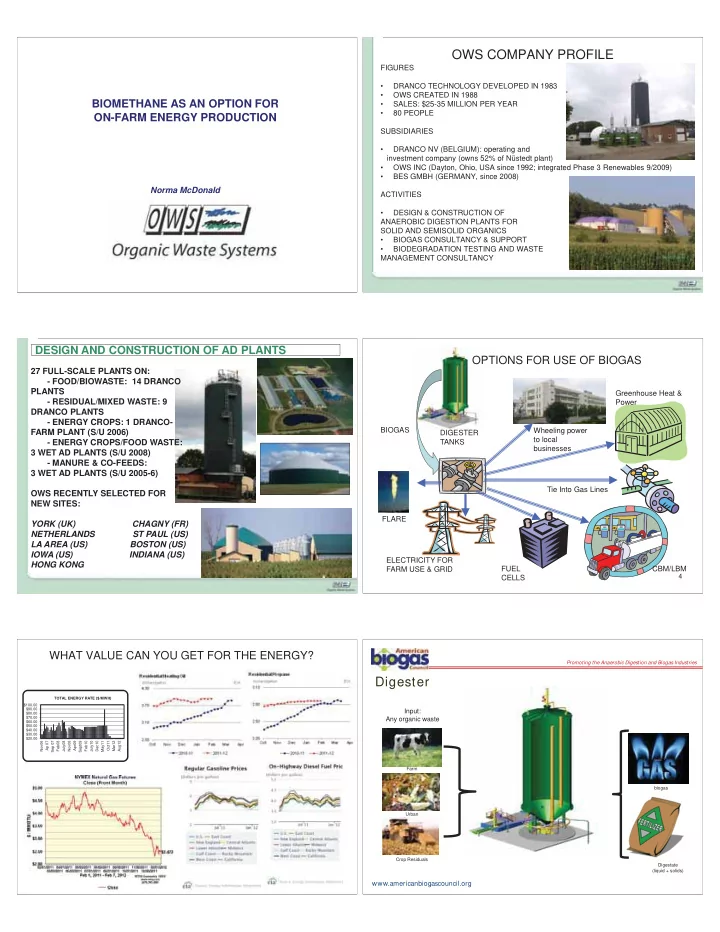
OWS COMPANY PROFILE
FIGURES
- DRANCO TECHNOLOGY DEVELOPED IN 1983
- OWS CREATED IN 1988
- SALES: $25-35 MILLION PER YEAR
- 80 PEOPLE
SUBSIDIARIES
- DRANCO NV (BELGIUM): operating and
investment company (owns 52% of Nüstedt plant)
- OWS INC (Dayton, Ohio, USA since 1992; integrated Phase 3 Renewables 9/2009)
- BES GMBH (GERMANY, since 2008)
ACTIVITIES
- DESIGN & CONSTRUCTION OF
ANAEROBIC DIGESTION PLANTS FOR SOLID AND SEMISOLID ORGANICS
- BIOGAS CONSULTANCY & SUPPORT
- BIODEGRADATION TESTING AND WASTE
MANAGEMENT CONSULTANCY
2
DESIGN AND CONSTRUCTION OF AD PLANTS
27 FULL-SCALE PLANTS ON:
- FOOD/BIOWASTE: 14 DRANCO
PLANTS
- RESIDUAL/MIXED WASTE: 9
DRANCO PLANTS
- ENERGY CROPS: 1 DRANCO-
FARM PLANT (S/U 2006)
- ENERGY CROPS/FOOD WASTE:
3 WET AD PLANTS (S/U 2008)
- MANURE & CO-FEEDS:
3 WET AD PLANTS (S/U 2005-6) OWS RECENTLY SELECTED FOR NEW SITES: YORK (UK) CHAGNY (FR) NETHERLANDS ST PAUL (US) LA AREA (US) BOSTON (US) IOWA (US) INDIANA (US) HONG KONG
4
OPTIONS FOR USE OF BIOGAS
DIGESTER TANKS BIOGAS ELECTRICITY FOR FARM USE & GRID Greenhouse Heat & Power Tie Into Gas Lines CBM/LBM FUEL CELLS Wheeling power to local businesses FLARE
WHAT VALUE CAN YOU GET FOR THE ENERGY?
$20.00 $30.00 $40.00 $50.00 $60.00 $70.00 $80.00 $90.00 $100.00 Nov06 Ap 07 Sep 07 Feb08 July08 Nov08 Apr09 Sept09 Feb10 July10 Dec10 May11 Oct11 Mar12 Aug12 TOTAL ENERGY RATE ($/MWH)
www.americanbiogascouncil.org
Promoting the Anaerobic Digestion and Biogas Industries
Digester
Input: Any organic waste
Farm Urban Crop Residuals Digestate (liquid + solids) biogas