
SLIDE 1
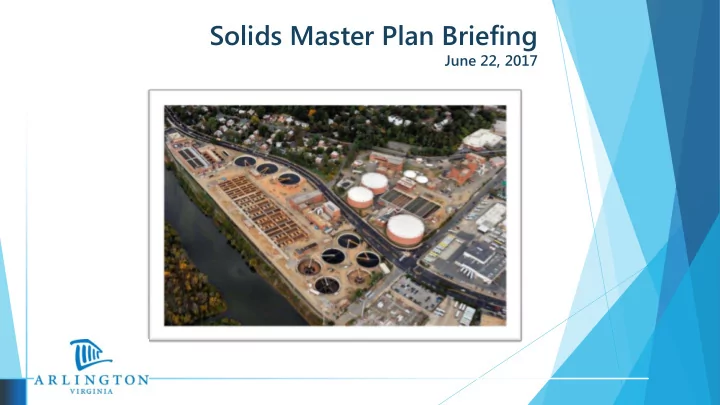
Solids Master Plan Briefing
June 22, 2017
Solids Master Plan Briefing June 22, 2017 Meeting Agenda Review of - - PowerPoint PPT Presentation
Solids Master Plan Briefing June 22, 2017 Meeting Agenda Review of Master Plan Process Status Update Technology Selection Budget & Next Steps Discussion Review of Master Plan Process Master Plan Process - Where Are We
June 22, 2017
Review of Master Plan Process Status Update Technology Selection Budget & Next Steps Discussion
choices
Set and Rank Criteria
Immediate needs
Condition Assessment
2016
Develop Alternatives
Winter 2017
Final Report
Ongoing outreach to stakeholders Ongoing peer review COMPLETED! COMPLETED! WE ARE HERE COMPLETED!
Workshop 1 - Kickoff and Project Objectives Defined
Workshop 2 - Define Screening and Evaluation Criteria
Workshop 3 - Technology Identification and Screening
Workshop 4 - Process Specific Analysis
Workshop 5 – Alternative Train Development and Preliminary Findings : Selection of top 4 alternatives
Workshop 6 – Weighted Criteria Ranking of Alternatives
Workshop 7 – Final Plan Recommendations
Universe of Technologies Screened Technologies and Process Analysis Top 4 Selected Alternatives
Ranking and Final Evaluation
Recommended Plan
Fall 2016 Initiated Virginia Tech lab-scale digestion pilot Toured UOSA (Centreville) to learn more about their Solids
Handling process
Winter 2017 Updated DES leadership on the Solids Master Plan process Met with WSSC (Prince Georges and Montgomery Counties) to
learn more about their Master Planning process
Held meetings with WPCP staff on the Solids Master Plan status,
and solicited feedback on alternatives
Spring 2017 Met with County Manager, Mark Schwartz, on Solids Master Plan Presented the Solids Master Plan process to industry leaders Presented to Arlington County community members – CivFed,
ACE, E2C2, FAAC, NCAC, AHCA
Optional Meeting with Stakeholders to discuss emissions,
regional solutions, and financing
Arlington County partnered with
Virginia Tech to research which anaerobic digester operating conditions and dewatering methods resulted in optimized gas production and reduced odors.
The results found that Arlington’s
raw sludge are within the expected range for gas production and methane content.
Variables such as dewatering
method, polymer dose, and storage time all impacted odor production.
The results showed that Arlington’s
digestion process would be more stable than industry standards.
Name Biosolids quality Major features Lime Stabilization rehab-only Class B What we have now; highest amount of biosolids and trucks; no gas production; odorous Anaerobic Digestion (AD) Class B Biosolids volume lower; gas production; fewer odors Thermal Hydrolysis (THP) + Anaerobic Digestion Class A Biosolids volume reduced further; more gas production; fewer odors Anaerobic Digestion + Heat Drying Class A Least amount of biosolids; no net gas production; fewer odors
12
5.85 8.06 6.71 6.12 14.70 14.07 11.79 12.07 7.78 9.09 10.14 8.76 3.04 4.77 5.56 5.43 5 10 15 20 25 30 35 40 Lime AD THP+AD AD+DRY ECONOMIC OPERATIONAL ENVIRONMENTAL SOCIAL
AD HAS HIGHEST OVERALL SCORE THP+AD IS SECOND OVERALL
Scores are very close; do not provide clear direction on path forward THP + AD highest on social and environmental
13
Pathogen Reductions: Meets Class A (higher
quality) standards
Fewer, smaller digesters: Thermal hydrolysis
greatly reduces the volume of the digester tanks – from 32
Higher rate of methane production: More
energy generation
Increased dewaterability: THP biosolids are
easier to dewater and require less polymer
Reduced trucking: THP reduces the quantity
Primary Sludge Secondary Sludge Holding/ Blending/ Tank(s) Screening and Pre-Dewatering
Anaerobic Digestion
Dewatering Land Application or Distribution and Marketing (Class A) Biogas to Utilization Centrate To Headworks CentrateTo Headworks Cake Hopper Holding Tank Cake Storage THP Reactors Steam Generator
Greater public acceptance More outlets for distribution: land
application, soil amendment, revenue stream…
Less land application restrictions than Class
B biosolids
Pathogen reduction – over 90% lower than
Class B requirements
Rigorous testing to ensure compliance Reduced hauling costs
76.10% 43% 12.10% 39.80% 0% 10% 20% 30% 40% 50% 60% 70% 80% 2010 2016
Percentage of Class A and Class B Biosolids over time in Mid-Atlantic Region
Class B Class A
BIOSOLIDS IN OUR COMMUNITY Class A option can be used as an organic soil
amendment – soil blends created now like Milorganite (Milwaukee) or Bloom (DC)
High nutrient content of biosolids means
little or no use of chemical fertilizers
ENERGY RECOVERY POSSIBILITIES Energy Recovery On-Site – Combined Heat and Power (CHP) Energy Recovery using biogas derived fuels is of interest to County
Transit Bureau - ART Bus Fleet runs on compressed natural gas (CNG) – New ART fueling station being constructed across the street from the Plant
Looking at digesting other organic wastes in future – would result in
greater gas production
Enterprise Funds are self-sufficient. Water-sewer rate set at level which, along with other
revenues including excess fund balance, will fully fund activities.
Ensuring that the rate stays at an affordable level is a key
goal of managing this fund.
Utilities Fund must balance the needs on the water and
wastewater sides
Capital Improvement Plan (CIP) process for FY2019-28 will
start in the fall and be adopted in July 2018.
10,000,000 15,000,000 20,000,000 25,000,000 30,000,000 35,000,000 40,000,000 45,000,000 FY16 FY17 FY18 FY19 FY20 FY21 FY22 FY23 FY24 FY25 FY26 FY27 FY28 FY29 FY30
Projected Utility Fund Annual Debt Service w/o Water Project
Existing VRA Debt Existing GO Debt Plant Debt Service (includes Solids Master Plan THP/AD) FY17-26 CIP Water & Sewer Infrastructure Debt Service
Finalize Master Plan Report Air Quality Study – Emissions from sources associated
with CNG and CHP options
Further Exploration of Regional Solutions
Meetings with DC Water
Determine proposed end use for biogas (CNG or CHP) Continue Phase 1 SMP Design Finalize timing of Phases 2 and 3 (depending on
Washington Aqueduct decisions)
Hold periodic update meetings with stakeholders
Review Solids Master Plan Report Conduct negotiations with outside entities:
DC Water, Washington Gas, and/or ART/WMATA bus facilities
Hire a Design Engineer Begin Design of Phase 2 and Phase 3 Projects Hire a Construction Manager Prepare drawings and specifications for construction Hold periodic update meetings with stakeholders