SLIDE 3 8/04/2019 2
14,277 12,738 13,628 12,465 12,230
1,000 1,200 1,400 1,600 1,800 2,000 2,200
14‐15 15‐16 16‐17 17‐18 18‐19F
8,000 9,000 10,000 11,000 12,000 13,000 14,000 15,000 EFS/ha at $6 payout GHG emissions CO2eq/ha
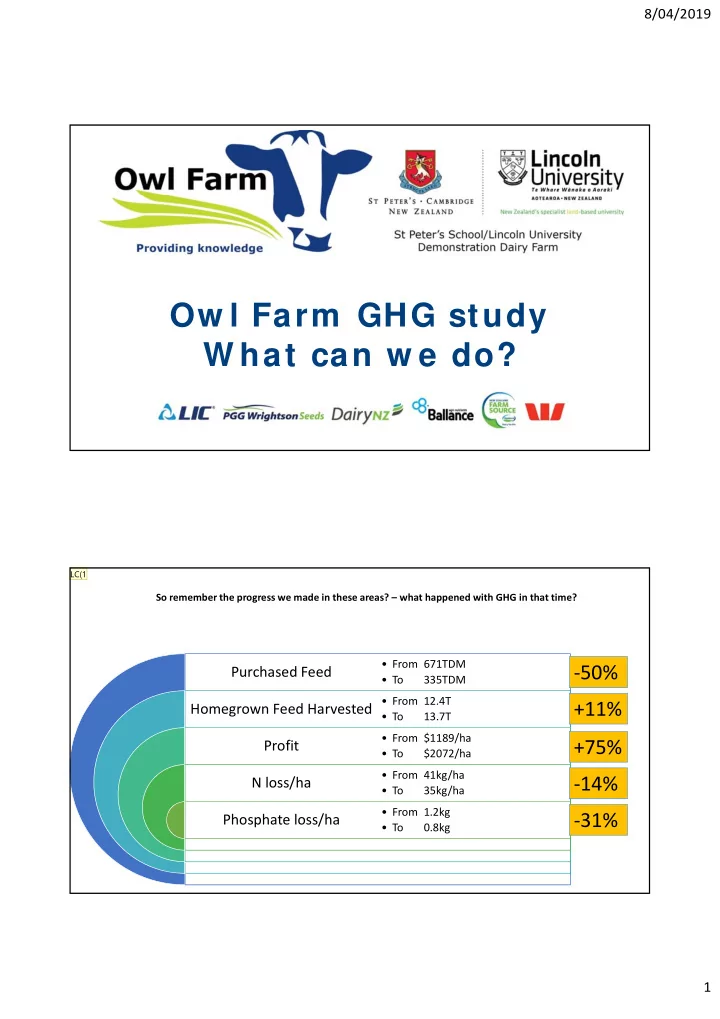
Owl Farm evolution Profit and total Emissions per ha
CO2 equivalents (kg/ha/yr) STD profit/ha $6
Drought Farm systems decision was around profit from efficiency. Co‐benefit has been a reduction in total emissions. Important to note there is a good chunk of variation between years. 14‐15,lots of feed and good payout, but lower efficiency and profit than 16‐17 with same MS/ha 15‐16, no lime applied, less CO2 emissions. Low pasture utilisation, = lower feed eaten/ha = lower MS/ha = lower profit/ha also meant less GHG/ha. Now, less total feed eaten and more efficient system = less emissions and more profit. Current year is more efficient again in feed conversion lower emissions. Lost autumn production due to dry weather will reduce the potential profit.
Emissions Efficiency
This is part of the story – as an industry the amount of milk we can now get from the same food has increased. This dotted line is where our national total Agriculture emissions would be if we hadn’t seen people improve the efficiency of feed required for product. So if a cow eats 1 kg of dry matter – she will create and burp out around 21gms
- f methane. It’s as simple as that.
If a cow makes one KgMS in a season she could eat anywhere between 11‐ 15kg of DM to do it. So every kilo of milksolids could create between 231‐ 315grams of methane. If she can make the kg of MS from 11kg
- f feed, instead of 14 on the same farm,
chances are we can see significant profitability increases along side the emissions decrease.