Overview of Woodford Gas-Shale Play of Oklahoma, U.S.A. Brian J. - - PowerPoint PPT Presentation

overview of woodford gas shale play of oklahoma u s a
SMART_READER_LITE
LIVE PREVIEW

Overview of Woodford Gas-Shale Play of Oklahoma, U.S.A. Brian J. - - PowerPoint PPT Presentation

Overview of Woodford Gas-Shale Play of Oklahoma, U.S.A. Brian J. Cardott Abstract a b c d e The Woodford Shale (Late Devonian-Early Quartz 63-68% 29-87% 30-60% 9-61% 27-53% Mississippian), an important hydrocarbon source rock in


slide-1
SLIDE 1

Generalized structure map of Woodford Shale in eastern Oklahoma (prepared by R. Vance Hall).

Overview of Woodford Gas-Shale Play of Oklahoma, U.S.A.

Brian J. Cardott

Abstract

The Woodford Shale (Late Devonian-Early Mississippian), an important hydrocarbon source rock in Oklahoma (south-central United States), is age-equivalent to Late Devonian gas shales in the United States (e.g., New Albany, Antrim, Ohio). It exceeds the minimum non- negotiable parameters necessary for an economic gas shale: gas source rock and fracture-able. Abundant oil- generative organic matter (e.g.., Type II kerogen; 2-14% total organic carbon) in the Woodford Shale is the source

  • f thermogenic methane and a bitumen network,

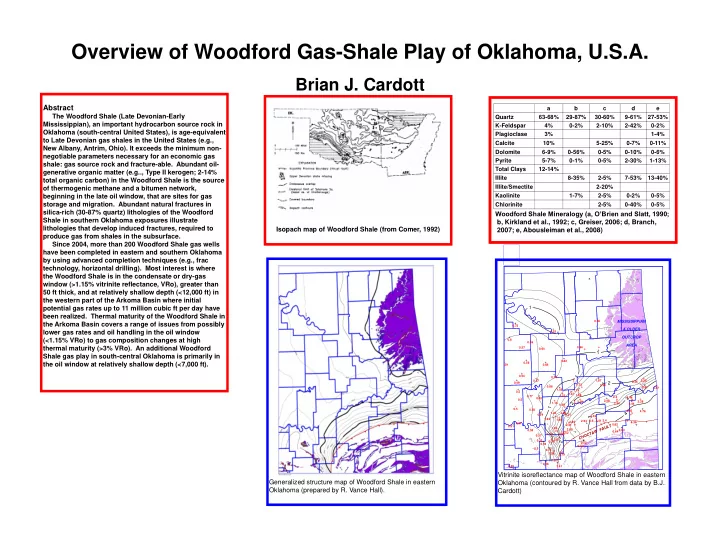
beginning in the late oil window, that are sites for gas storage and migration. Abundant natural fractures in silica-rich (30-87% quartz) lithologies of the Woodford Shale in southern Oklahoma exposures illustrate lithologies that develop induced fractures, required to produce gas from shales in the subsurface. Since 2004, more than 200 Woodford Shale gas wells have been completed in eastern and southern Oklahoma by using advanced completion techniques (e.g., frac technology, horizontal drilling). Most interest is where the Woodford Shale is in the condensate or dry-gas window (>1.15% vitrinite reflectance, VRo), greater than 50 ft thick, and at relatively shallow depth (<12,000 ft) in the western part of the Arkoma Basin where initial potential gas rates up to 11 million cubic ft per day have been realized. Thermal maturity of the Woodford Shale in the Arkoma Basin covers a range of issues from possibly lower gas rates and oil handling in the oil window (<1.15% VRo) to gas composition changes at high thermal maturity (>3% VRo). An additional Woodford Shale gas play in south-central Oklahoma is primarily in the oil window at relatively shallow depth (<7,000 ft). Isopach map of Woodford Shale (from Comer, 1992) Vitrinite isoreflectance map of Woodford Shale in eastern Oklahoma (contoured by R. Vance Hall from data by B.J. Cardott)

MISSISSIPPIAN & OLDER OUTCROP AREA CHOCTAW FAULT

1 1 1 1 4 3 3 2 2 2 1 1

1.31 0.56 0.79 0.59 0.78 2.19 0.64 0.64 2 1.73 2.09 1.37 1.79 1.98 1.87 0.57 1.23 1.05 0.86 0.74 1 0.72 3.32 2.69 0.52 2.94 0.58 0.5 0.55 0.57 0.58 0.83 0.77 1.14 1.23 0.79 2.53 0.57 0.56 0.6 1.69 0.82 3.46 2.4 2.44 2.48 3.41 3.4 3.6 3.36 3.44 4.85 6.36 4.76 0.59 0.56 0.54 0.49 0.57 0.5 0.5 0.5 0.56 2.81 3.47 2.25 2.26 1.88 0.52 0.64 0.62 0.63 1.88 1.89 2.52 2.51 0.49 0.51 1.15 1.66 1.62 2.85 0.94 1.61 2.01 1.58 2.31 1.03

PETRA 8/10/2007 11:30:29 AM

Woodford Shale Mineralogy (a, O’Brien and Slatt, 1990; b, Kirkland et al., 1992; c, Greiser, 2006; d, Branch, 2007; e, Abousleiman et al., 2008)

a b c d e Quartz 63-68% 29-87% 30-60% 9-61% 27-53% K-Feldspar 4% 0-2% 2-10% 2-42% 0-2% Plagioclase 3% 1-4% Calcite 10% 5-25% 0-7% 0-11% Dolomite 6-9% 0-56% 0-5% 0-10% 0-6% Pyrite 5-7% 0-1% 0-5% 2-30% 1-13% Total Clays 12-14% Illite 8-35% 2-5% 7-53% 13-40% Illite/Smectite 2-20% Kaolinite 1-7% 2-5% 0-2% 0-5% Chlorinite 2-5% 0-40% 0-5%

slide-2
SLIDE 2

Woodford Shale gas well completions by major operator on isoreflectance map, 2004-2008 (321 wells) Oklahoma gas shale well completions, 1939-2008 (471 wells; 70 Caney wells; 401 Woodford wells) Woodford Shale gas well completions by year, 2004-2008 (overlay of 2007 & 2008 wells; 389 wells)

20 40 60 80 100 120 140 160 180 200 1930 1940 1950 1960 1970 1980 1990 2000 2010

Year Number of Wells

20 40 60 80 100 120 140 160 180 200 2000 2001 2002 2003 2004 2005 2006 2007 2008 2009 2010

Year Number of Wells

Discovery Wells

Woodford Shale gas well completions, 1939-2008 (405 wells)

553 ft (IP 122 Mcf) 15,310 ft (IP 234 Mcf; 7BO 42° API; GOR 33,429)

50 100 150 200 250 1930 1940 1950 1960 1970 1980 1990 2000 2010

Year Number of Wells

Caney Woodford

Oklahoma Gas Shale Completion History (1939-2007) Woodford Gas Shale Completion History (1939-2007) Woodford Shale Gas Field Discovery History Woodford Shale Well-Type History

20 40 60 80 100 120 140 160 180 200 2000 2001 2002 2003 2004 2005 2006 2007 2008 2009 2010

Year Number of Wells

Horizontal Vertical

slide-3
SLIDE 3

10 100 1,000 10,000 100,000 1,000,000 10,000,000 Jan-04 Apr-04 Jul-04 Oct-04 Jan-05 Apr-05 Jul-05 Oct-05 Jan-06 Apr-06 Jul-06 Oct-06 Jan-07 Apr-07 Jul-07 Oct-07

Date Average Monthly Production (Mcf)

Gas Oil

352 Woodford wells (depth & IP pairs): depth 570-15,310 ft; IP 3-11,200 Mcfd. 253 Horizontal Woodford Wells (depth & IP pairs): depth 1,349-12,486 ft TVD; IP 3-11,200 Mcfd.

Initial Potential Gas vs Depth

1 10 100 1,000 10,000 100,000 2,000 4,000 6,000 8,000 10,000 12,000 14,000 16,000

Depth (feet) Initial Potential (Mcfd)

Woodford Woodford Horizontal

41 Woodford Shale Oil/Condensate Producing Wells (2004-2007) Woodford Shale Production (2004-2007) Cumulative production from Woodford-only wells: 63,752,439 Mcf gas, 66,538 BBLS oil/condensate from 279 wells (excluding 23 OWWO; data from IHS Energy)

Woodford Shale Wells with Initial Potential Gas Rates >1MMcfd (226 of 405 wells)

slide-4
SLIDE 4

THERMAL MATURITY AND STRUCTURE Vitrinite reflectance of Woodford Shale in southern Oklahoma on Woodford Shale structure map (Woodford Shale structure map prepared by Carlyle Hinshaw in 1999; vitrinite-reflectance data by Cardott, in preparation).

SOUTHERN OKLAHOMA

2,000 4,000 6,000 8,000 10,000 12,000 14,000 16,000 18,000 20,000 0.00 0.50 1.00 1.50 2.00 2.50 3.00

Vitrinite Reflectance (%Ro) Depth (feet)

Tasmanites green fluorescence indicates immature thermal maturity

0.49-0.52% Rm Tasmanites green fluorescence 0.50% Rm Tasmanites green fluorescence 0.50% Rm Tasmanites green fluorescence 0.56% Rm Tasmanites green fluorescence

“Loss of fluorescence of Tasmanites alginites is reached at a stage corresponding to 0.9-1.0% Rr (vitrinite)” Taylor et al., 1998, p. 137

Portion of subsurface structure map of Marshall County, OK (modified from Huffman, 1987). Structure contours drawn on top of Viola Group (ft below mean sea level).

slide-5
SLIDE 5

100 1,000 10,000 100,000 1,000,000 1970 1973 1976 1979 1982 1985 1988 1991 1994 1997 2000 2003 2006 2009

Date Average Annual Production (Mcf)

GAS PRODUCTION IN OIL WINDOW

Two examples of gas production from naturally-fractured Woodford Shale in the Madill and Aylesworth anticlines in the Ardmore Basin demonstrate gas production with little or no reported oil production at relatively shallow depths (e.g., @4,000 ft) where the Woodford Shale is in the oil window (@0.6% Ro). Even though Type II Kerogen is capable of generating about 75%

  • f source-rock thermogenic methane by

1.1% Ro (Lewan, 2002), these examples may be special cases where thermogenic gas migrated into the Woodford Shale from deeper in the Ardmore Basin. Gas isotope data from these wells are not available.

100 1,000 10,000 100,000 1,000,000 Jan-90 Jan-92 Jan-94 Jan-96 Jan-98 Jan-00 Jan-02 Jan-04 Jan-06 Jan-08 Jan-10

Date Average Monthly Production (Mcf)

MADILL FIELD Cimarex Energy of Colorado 3 Griffin-Olmstead well Marshall Co.; NW¼ NW¼ NE¼ 16-5S-5E Originally completed as oil well in McLlish (6,536- 6,544 ft) in 1955, oil workover well in McLish and Bromide (5,664-5,696 ft) in 1956, and gas workover well in Woodford Shale (4,052-4,135 ft) in 1992. IP 747 Mcfd; Cumulative Woodford Shale gas production of 1,792,734 Mcf from March 1992 to October 2007 (data from IHS Energy) SE AYLESWORTH DISTRICT FIELD Verdad Oil & Gas Corp. 1 Mary Haynie well Bryan Co.; NW¼ SE¼ SW¼ SE¼ 22-6S-7E Originally completed as gas well in Misener sand (4,192-4,227 ft) in 1956 and plugged back to Woodford Shale (3,710-4,054 ft) in 1974. IP 962 Mcfd; Cumulative Woodford Shale gas production of 2,330,605 Mcf from November 1974 to August 2007. Produced 178 bbls oil in 1995 (data from IHS Energy) Principal subsurface structural features in Marshall County (from Huffman and others, 1987) Structure contour map of the top of the Viola Group (Ordovician) in the Aylesworth and SE Aylesworth District fields (from Huffman and

  • thers, 1987)

Structure contour map of the top of the Viola Group (Ordovician) in the North Madill field (from Huffman and others, 1987) Cross section C-C’ of the SE Aylesworth District field (from Huffman and others, 1987) Cross section D-D’ of the North Madill field (from Huffman and

  • thers, 1987)

3 Griffin-Olmstead 1 Mary Haynie

3 Griffin-Olmstead well 1 Mary Haynie well