
SLIDE 1
Shale Gas Development in Pennsylvania Managing the Risks of Shale - - PowerPoint PPT Presentation
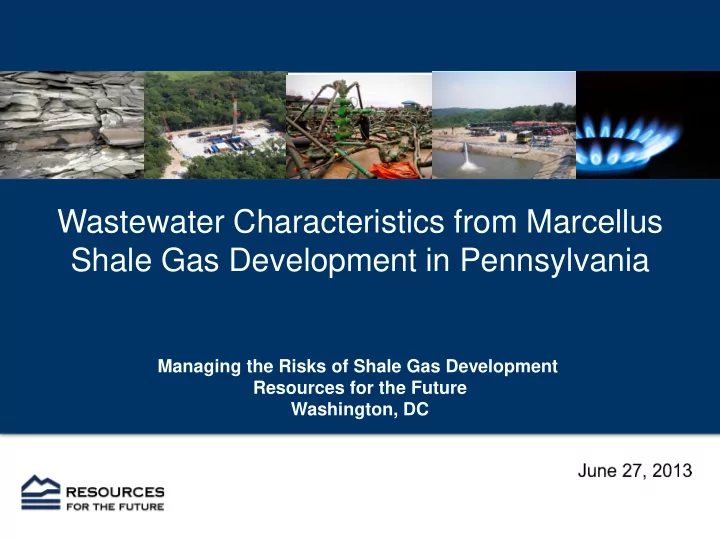
[Add your own pictures here] Wastewater Characteristics from Marcellus Shale Gas Development in Pennsylvania Managing the Risks of Shale Gas Development Resources for the Future Washington, DC RFF project focuses on environmental risks
2
3
4
5
NON-COAL MINING, OIL AND GAS, AND OTHER WELL DRILLING WASTES
801 Drilling Fluids, Residuals (other than those under 802-810; includes drill cuttings from monitoring well and drinking water well construction) 802 Brine (natural salt water separated at oil and gas wells) 803 Drilling Fluid Waste (oil and gas drilling mud,
spent lubricant) 804 Fracing Fluid Waste (oil and gas drilling fracturing fluid, flow-back fracturing fluid, flow- back fracturing sand) 807 Basic Sediment (oil and gas production storage impurities, sediment from produced oil at storage tank battery) 808 Servicing Fluid (oil and gas production well maintenance/work over fluids, oil/water-based mud and foam) 809 Spent Lubricant Waste (spent oil and gas drilling lubricants, spent plug drilling lubricants) 810 Drill Cuttings (oil and gas drill cuttings)
6
Acidity Chemical Oxygen Demand Magnesium Silver Alkalinity (Total as CaCO3) Chlorides Manganese Sodium Aluminum Chromium MBAS (Surfactants) Specific Conductance Ammonia Nitrogen Cobalt Mercury Strontium Arsenic Copper Molybdenum Sulfates Barium Ethylene Glycol Nickel Thorium Benzene Gross Alpha Nitrite-Nitrate Nitrogen Toluene Beryllium Gross Beta Oil & Grease Total Dissolved Solids Biochemical Oxygen Demand Hardness (Total as CaCO3) pH Total Kjeldahl Nitrogen Boron Iron – Dissolved Phenolics (Total) Total Suspended Solids Bromide Iron – Total Radium 226 Uranium Cadmium Lead Radium 228 Zinc Calcium Lithium Selenium
Additional constituents that are expected or known to be present in the wastewater.
7
8
9
10
11
12
13
14
15
16
18
Surface water fracing fluid additives Groundwater Hydraulic fracturing Pound/ tank Onsite treatment Offsite WWTF Surface discharge Other high value reuse landfill Drilling fluid additives Drilling Pound/ tank Onsite treatment Flowback water Produced water Deep well injection Pound/ tank
Sampling location Clean water Chemicals Wastewater Recycling Mixing tank
Chemicals Chemicals
19
20
F26R_802 MSC Study F26R_804 Produced Parameter Influent 5-Day Flowback 14-Day Flowback Flowback Water pH 7.2 6.6 6.2 6.9 5.8 Alkalinity 52.5 138 85.2 1819.7 2521.9 TDS 334 67300 120000 60156.5 182948.6 TSS 9.6 99 209 387.5 205.7 TOC 3.8 62.8 38.7 79.8 1928.5 BOD 149 2.8 2.8 595.4 855.6 Oil & Grease 31 < 5 7.4 NA NA Sodium 67.8 18000 16383 35887.7 Calcium 32.9 4950 4982 15003.6 Magnesium 6.7 559 491.6 1412.4 Iron 1.2 39 41.9 106.5 Barium 0.4 686 1025.8 84328.8 Chloride 42.3 41850 40462.5 99711.8
21
Primary environmental public health concerns: Parameter NOB Median (mg/L) Standard (mg/L) Note Barium 159 651 2 EPA MCL Barium 159 651 10 PA wastewater effluent standards monthly average Strontium 156 1275 4 EPA recommended limit for finished municipal drinking water Strontium 156 1275 10 PA wastewater effluent standards monthly average Benzene 44 0.05 0.005 EPA MCL Ecological and secondary drinking water concerns: Chlorides 154 53250 250 EPA SMCL, PA wastewater effluent standards Magnesium 152 581 0.05 EPA SMCL TDS 156 87150 500 EPA SMCL, PA wastewater effluent standards Sulfate 78 86 250 EPA SMCL
22
23