
SLIDE 1
Working Group on Calibration and Validation
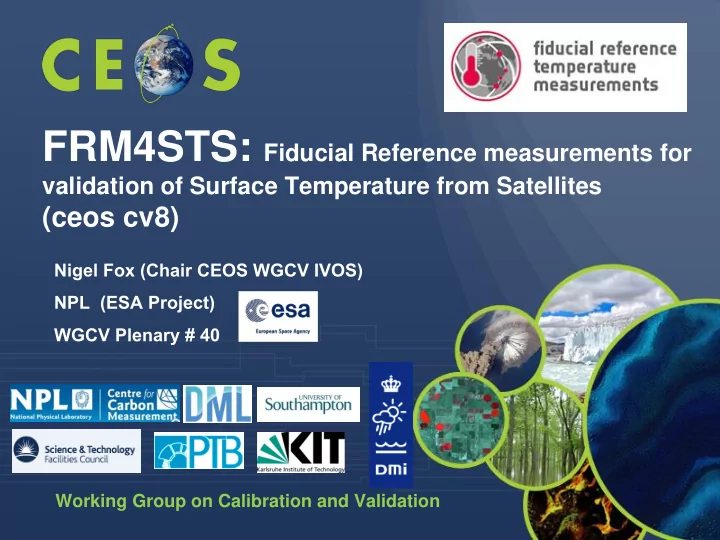
FRM4STS: Fiducial Reference measurements for
validation of Surface Temperature from Satellites
(ceos cv8)
Nigel Fox (Chair CEOS WGCV IVOS) NPL (ESA Project) WGCV Plenary # 40
Overview of project Aim: to establish and maintain SI traceability - - PowerPoint PPT Presentation
FRM4STS: Fiducial Reference measurements for validation of Surface Temperature from Satellites (ceos cv8) Nigel Fox (Chair CEOS WGCV IVOS) NPL (ESA Project) WGCV Plenary # 40 Working Group on Calibration and Validation Overview of project
Working Group on Calibration and Validation
Nigel Fox (Chair CEOS WGCV IVOS) NPL (ESA Project) WGCV Plenary # 40
2
Aim: to establish and maintain SI traceability of global Fiducial Reference Measurements (FRM) for satellite derived surface temperature product validation and help develop a case for their long term sustainability Requires:
conditions
how to achieve – through provision of guidance and best practises and access to standards and comparisons Context: CEOS plenary (2014) endorsed a project to carry out a series of comparisons of instrumentation & methods used to validate satellite IR measurements of surface (Ocean, Land) Temp to ensure international harmonisation ( (an extension of previous ‘Miami series’)
3
participants calibration processes for FRM TIR radiometers (SST, LST, IST)
sources used to maintain calibration of FRM TIR radiometers.
environmental effects e.g. sky radiance
radiometers on board ships to build a database of knowledge over a several yrs
effects in real world sites.
performance of FRM of Surface temperatures.
rigour (e.g. detailed uncertainty breakdown).
satellites validation and CDRs of high accuracy Ocean temperature measurements using buoys and similar floating systems. m
4
Necessary for all participants to assess biases to SI under Laboratory conditions 19 participants
5
6
7
8
9
Footer
Earth Observation, Climate & Optical Group NPL, UK
e.theo@npl.co.uk
28th April 2016
Directory of external participants 2016 comparison
S.No Contact person Organisation Institute Phone No. Email id Comments Initial Invitation sent (28Oct15)? (Y/N) Confirmed Attending? (1/0) 1A: Laboratory 1B: WST @ NPL 1C: LST @ NPL 2A: Shipborne comparisons 2B: LST @ Gobabeb 2C: IST @ Greenland Funding assistance required? (Y/N/M) CEOS Agency Blackbody What Radiometer? 1 Michael Reynolds RMRCo, Seattle Remote Measurement & Research Co., 214 Euclid Av., Seattle WA 98122 Tel: +1 631-374-2537 michael@rmrco.com Developed a new instrument called
Y 1 Y Y Y Y N N M TBC BB ISAR & RORSR 2 Jacob Høyer DMI Danish Meteorological Institute (DMI), Centre for Ocean and Ice, Lyngbyvej 100, 2100 København Ø Tel: +4539157203 jlh@dmi.dk ISAR? Y 1 Y Y N N N Y N ISAR? 3 Frank-M. Göttsche / Folke Olesen KIT IMK-ASF, Karlsruhe Institute of Technology (KIT), Hermann-von-Helmholtz-Platz 1, 76344 Eggenstein-Leopoldshafen, Germany +49 721 608-23821 frank.goettsche@kit.edu, folke.olesen@kit.edu Heidronics KT15.85 Y 1 Y Y Y N Y M N CEOS WGCV (LPV subgroup) BB Heidronics KT15.85 4 Nicole Morgan, (Helen Beggs) Bureau of Meteorology, Australian Govt. Ocean Modelling Research Team, Research and Development Branch, Bureau of Meteorology GPO Box 1289 Melbourne VIC 3001, Level 11, 700 Collins Street, Docklands VIC 3008 Nicole +613 6232 5222 Helen: +61 3 9669 4394 Nicole.Morgan@csiro.au h.beggs@bom.gov.au http://www.bom.gov.a u- ISAR Y 1 Y Y M Y N N N Casots II ISAR 5 Manuel Arbelo GOTA Grupo de Observacion de la Tierra y la Atmosfera (GOTA), ULL, Spain marbelo@ull.es Cimel CE312 (5_channels) Y 1 Y Y Y M M N CDIT_Spain BB Cimel CE312 (5 channels) 6 Gerardo Rivera (Simon Hook) JPL-NASA Carbon Cycle and Ecosystems, MS 183-501, Jet Propulsion Laboratory,4800 Oak Grove Drive ,Pasadena, CA 91109 gerardo.rivera@jpl.nasa.gov simon.j.hook@jpl.nasa.gov has a new generation nulling radiometer Y 1 Y Y Y Y M M N NASA Nulling radiometer 7
Imaging Processing Laboratory (IPL) Universitat de Valencia Imaging Processing Laboratory (IPL), Parque Científico Universitat de Valencia, Poligono La Coma s/n , Tel: +34 96 354 3115; sobrino@UV.es Y 1 y m n M N N M 8 Tim Nightingale STFC STFC Rutherford Appleton Laboratory,Chilton, Didcot Oxon OX11 0QX,United Kingdom Tel: +44 1235445914; Tim.Nightingale@stfc.ac.uk Has a SISTeR Radiometer Y 1 Y Y N Y N N M UKSA BB Casots I SiSTER 9 Caroline Sloan MOD, NAVY SHIPS-HM FEIO Fleet Environmental Information Officer, NAVY SHIPS-HM FEIO | Navy Command Headquarters, MP 2.3, Leach Building, Whale Island, Portsmouth, Hampshire, PO2 8B Tel: 023 9262 5958 | Mil: 93832 5958; caroline.sloan104@mod.uk ; NAVYSHIPS-HMFEIO@mod.uk; ISAR Y 1 y M N M N N M ISAR 10 Ian Barton CSIRO Australia Head office, PO Box 225,Dickson ACT 2602, Australia Tel: +61 3 9545 2176; ian.barton@ozemail.com.au TASCO THI-500 Y 1 Y N N N N N N TASCO THI-500 11
Raquel Niclòs Vicente Garcia Santos UV-ES
Faculty of Physics,University of Valencia,Dr. Moliner, 50. 46100 Burjassot, Spain raquel.niclos@uv.es cesar.coll@uv.es vicente.garcía- santos@uv.es 5 radiometers in total Y 1 Y Y Y M Y N N 110 cm BB CIMEL plus other four 12 Peter J Minnett Goshka or Miguel RSMAS Rosenstiel School, University of Miami,4600 Rickenbacker Causeway,Miami, FL 33149,USA pminnett@rsmas.miami.edu MaERI and ISAR Y 1 Y N N Y N M M NASA & NOAA BB MaERI and ISAR 13 Steinar Eastwood Norwegian Meteorological Institute P.O.Box 43 – Blindern N-0313 Oslo, Norway s.eastwood@met.no Campbell Science IR120 with Apogee for sky measurement Y 1 Y Y N M N Y N Norwegian Space Centre Campbell Science IR120 14 Laurent Poutier ONERA 2, avenue Edouard Belin – 31055 Toulouse Cedex4 - laurent.poutier@onera.fr Heidronics & BOMEM Y 1 Y M Y N Y N Y ESA Mikrom M345 Heidronics & BOMEM 15
Wimmer Southampton Univerity w.wimmer@soton.ac.uk ISAR Y 1 Y Y N Y N Y N UKSA BB ISAR 16 Rasmus Tonboe DMI Lyngbyvej 100, DK-2100 Copenhagen, Denmark rtt@dmi.dk ISAR, KT15, CS Y 1 M M M M N Y N ESA ISAR, KT15, CS 17 William Good Bill Emery Ball Aerospace EDU- USA 1600 Commerce Street, Boulder, CO 80301, wgood@ball.com emery@colorado.edu Two radiometers: CIRiS- demonstrator and BESST Y 1 Y M M M N N Y NASA Two radiometers: CIRiS-demonstrator and BESST 18 Kailin Zhang Qingdao Ocean University of China 238 Songling Road, Qingdao zhangkl@ouc.edu.cn ;
Y 1 y y N N N N BB
19 Minglun Yang Qingdao Ocean University of China Qingdao, China minglunyang@163.com ; ISAR Y 1 y y N N N N ISAR 18Y + 1M 12Y + 5M 6Y + 3M 3Y + 2M 4Y + 2M
and published on the project’s website.
beginning 20th June.
blackbody comparison.
(which is a copy of the NIST water-bath blackbody), to CASOTS type I and II, and to small blackbodies (Landcal and Mikron).
1 3
standard radiometers. The transfer radiometers used will be:
the NPL AMBER radiometer which measures the brightness temperature of the blackbodies for a wavelength of 10.1 m, and the PTB infrared broadband radiometer which measures the brightness temperature of the blackbodies in the 8 µm to 14 µm wavelength range.
measurements will be compared at a minimum of three nominal temperatures of 283 K, 293 K and 303 K.
measurements, the comparison will be extended down to 273 K and up to 323 K.
measurements, the comparison can be over the 253 K to 278 K temperature range.
1 5
The AMBER radiometer measuring the radiance temperature of blackbodies during the 2009 Workshop at NPL.
AMBER will be assisted by the PTB IR filter radiometer.
16
17
21st April Canary BB at 30 oC
29.818 29.82 29.822 29.824 29.826 29.828 29.83 5 10 15 20 25
Time/min Temperature/oC
Difference between the temperature of the blackbody cavity provided by the participants and the brightness temperature of the same blackbody measured by the AMBER radiometer at different blackbody set temperatures.
Set temperature Temperature "error" Temperature "error" Participant
21st April run 22nd April run mK mK RAL 30 14 6 SISTeR BB 20
10
Southampton 30
3 ISAR BB 20
10
GOTA 30
La Laguna Univ. 20
Canary Island 10
DEPT 30
Valencia University 20
LAND P80P 10
and is published on the project’s website.
20th June.
radiometers to the 2016 radiometer comparison (one participant is bringing 5 radiometers, another 3 and some 2 radiometers).
spectrometer based), to seven ISARs, to small radiometers (Heitronics, CIMEL) and at least one “home-made” radiometer.
ammonia heat-pipe blackbody calibrated traceable to SI.
a variable temperature BB, it is well-characterised has a high spectral emissivity and has a 75 mm diameter aperture, which is sufficiently large to accommodate the field of view of any participating radiometer.
“known” temperature and then viewed by all participating radiometers.
blackbody in the -50 °C to +50 °C temperature range in 10 °C step.
perform measurements of the reference radiance blackbody at at least four nominal temperatures of 278 K, 283 K, 293 K and 303 K.
perform measurements of the reference blackbody in the range 273 K to 323 K.
perform measurements of the blackbody in the range 253 K to 293 K.
temperature lower than 233 K so the response of all radiometers can also be tested at this temperature.
NPL ammonia heat-pipe blackbody will be the reference blackbody during the 2016 radiometer lab comparison.
Heat-pipe blackbodies offer much better spatial uniformity in heating the cavity. The BB can cover the
Cavity size: 75 mm in diameter and 300 mm long.
23
ISAR radiometer viewing the NIST blackbody at 30 oC, 100 mm aperture, <Radiometer measurement> – <NIST blackbody temp> = 0.027 K, (brackets indicate average over time interval shown)
ISAR Radiometer looking at NIST BB at 30 oC with 100 mm aperture, data CORRECTED by 40 mK (reads 27mK high) 29.79 29.8 29.81 29.82 29.83 29.84 29.85 29.86 29.87 29.88 20:24:00 20:38:24 20:52:48 21:07:12 21:21:36
Time (UTC)
Temperature/oC
NIST BB ISAR reading
Radiometer viewing blackbody at 30 oC. The figure legend indicates the deviation of the different radiometer channels from the average blackbody temperature, over the measurement interval.
26
GOTA Cimel CE-312-2 radiometer looking at the NIST BB, with 45 mm aperture, at 30 oC, (errors shown in the legend)
29.8 29.9 30.0 30.1 30.2 30.3 30.4 30.5 18:20:10 18:23:02 18:25:55 18:28:48 18:31:41 18:34:34 time (UTC) Temperature (oC)
NIST blackbody 8 - 14 μm, 610 mK high 11.35 μm, 220 mK high 10.65 μm, 230 mK high 9.1 μm, 180 mK high 8.7 μm, 170 mK high 8.3 μm, 240 mK high
Plot of the mean of the differences of the radiometer readings from the temperature of the NPL variable temperature blackbody (blue circles), maintained at a nominal temperature of 10 oC. The red squares show the points corresponding to the RSMAS blackbody.
27
10 oC
0.5 1 1.5 2
Val 1 (10.7) Val 1 (10.8) Val 2 (12) Val 2 (8.8) GOTA (8 to 14) GOTA (11.35) GOTA (10.65) GOTA (9.1) GOTA (8.7) GOTA (8.3) IPL (11.29) IPL (9.15) IPL (8.44) ISAR RAL KIT OUC CEAM R1 CEAM R3 CEAM R5 DLR
Radiometer-participant Difference from reference temperature (oC)
NPL RSMAS
27.6 27.8 28 28.2 28.4 28.6 28.8 29 29.2 29.4 12/05/2009 14:24 12/05/2009 19:12 13/05/2009 00:00 13/05/2009 04:48 13/05/2009 09:36 13/05/2009 14:24 13/05/2009 19:12
Time (UT) SST (oC) MAERI ISAR KIT RAL
Difference of the continuously-reading radiometers (MAERI, ISAR, KIT and RAL-SISTeR) from their mean
0.1 0.2 0.3 0.4
12/05/2009 14:24 12/05/2009 19:12 13/05/2009 00:00 13/05/2009 04:48 13/05/2009 09:36 13/05/2009 14:24 13/05/2009 19:12
Time (UT) Difference from mean/oC
MAERI ISAR KIT RAL
Difference of the ocean surface temperature measurements of the radiometers which participated at the 2009 comparison compared to the measurements completed by the ISAR radiometer
0.00 0.40 0.80 12/05/2009 14:24 12/05/2009 19:12 13/05/2009 00:00 13/05/2009 04:48 13/05/2009 09:36 13/05/2009 14:24 13/05/2009 19:12
Time (UT) Difference from ISAR (oC) MAERI KIT RAL CEAM RA1 CEAM RA2 CEAM RA3 GOTA 8 to14 GOTA 8.7 GOTA 8.3 GOTA 9.1 GOTA 10.65 GOTA 11.35 DLR
data from the FRM4STS comparison, it was concluded that this task can be addressed using a File Transfer Protocol (FTP) server.
considerably less expensive compared to using a professional data storage organization.
retrieval of data of a number of different projects. The data saved under the FTP server will be regularly backed up following common practices of the NPL IT support team.
with the files stored and their contents.
(D110) was prepared.
measurements in an appropriate database so they can be retrieved and used by groups having an interest in scrutinising the performance of the different radiometer systems used to collect FRM data for use in satellite validation activities (D140) was prepared.
comparison.
All the measurements which will be made as part of the current FRM4STS comparison will be included on the comparison website http://www.frm4sts.org/ under the “Data Resources” menu and in the “FRM4STS – Results Database” directory. The FTP server will allow the access of stored data files (read only) to users which can authenticate themselves using a username and a password. NPL will be the only organisation able to change the contents of the FTP server.
Layout of the database showing how the measurements of the participants’ laboratory radiometer comparison will be stored
IST comparison LST comparison in Namibia LST comparison at NPL Radiometer & Blackbody Lab Comparison Participant 1 Radiometer comparison Measurements at 10 C Measurements at 20 C First set of measurements at 20 C Participant raw data at 20 C Pilot data at 20 C Combined Summary data at 20 C Second set of measurements at 20 C Participant raw data at 20 C Pilot Data at 20 C Combined Summary data at 20 C Measurements at 30 C Blackbody comparison Participant 2 Participant 3 Participant 4 WST comparison at Wraysbury
ISAR radiometer, 21st April 2009
5.55 5.60 5.65 5.70 5.75 5.80 5.85 5.90 13:43:41 13:49:26 13:55:12 14:00:58 14:06:43 14:12:29 14:18:14
Time (UTC) T (deg C) ISAR data PRT data
Layout of the database showing how the measurements of the participants’ laboratory blackbody comparison will be stored.
IST comparison LST comparison in Namibia LST comparison at NPL Radiometer & Blackbody Lab Comparison Participant 1 Blackbody comparison Measurements at 10 C Measurements at 20 C Measurement made with AMBER radiometer First set of measurements at 20 C Participant raw data (1st measur.) Pilot Data (1st measurement) Combined Summary data (1st measurement) Second set of measurements at 20 C Participant raw data (2nd measur.) Pilot Data (2nd measurement) Combined Summary data (2nd measurement) Measurements made with the PTB radiometer First set of measurement at 20 C Participant raw data (1st measurement) Pilot Data (1st measurement) Combined Summary data (1st measurement) Second set of measurements at 20 C Participant raw data (2nd measurement) Pilot Data (2nd measurement) Combined Summary data (2nd measurement) Measurements at 30 C Radiometer comparison Participant 2 Participant 3 Participant 4 WST comparison at Wraysbury
21st April Canary BB at 30 oC 29.818 29.82 29.822 29.824 29.826 29.828 29.83 5 10 15 20 25 Time/min Temperature/oC measurements were being acquired, etc.
measurements made by the test radiometer and the corresponding average value of the actual reference blackbody temperature will also be given.
measurement will also be given, to indicate the drift in the test radiometer responsivity at that particular temperature setting.
19.5 20 20.5 21 21.5 22 22.5 23
00:00:00 01:12:00 02:24:00 03:36:00 04:48:00 06:00:00 07:12:00 08:24:00 09:36:00 10:48:00 12:00:00 13:12:00 14:24:00 15:36:00 16:48:00 18:00:00 19:12:00 20:24:00 21:36:00 22:48:00 00:00:00 01:12:00 02:24:00 03:36:00 04:48:00 06:00:00 07:12:00 08:24:00 09:36:00 10:48:00 12:00:00 13:12:00 14:24:00 15:36:00 16:48:00 18:00:00 19:12:00 20:24:00 21:36:00 22:48:00
Temparature/°C Time 21st 22nd
25 27 29 31 33 35 37 39 41 43 00:00:00 01:04:00 02:08:00 03:12:00 04:16:00 05:20:00 06:24:00 07:28:00 08:32:00 09:36:00 10:40:00 11:44:00 12:48:00 13:52:00 14:56:00 16:00:00 17:04:00 18:08:00 19:12:00 20:16:00 21:20:00 22:24:00 23:28:00 00:32:00 01:36:00 02:40:00 03:44:00 04:48:00 05:52:00 06:56:00 08:00:00 09:04:00 10:08:00 11:12:00 12:16:00 13:20:00 14:24:00 15:28:00 16:32:00 17:36:00 18:40:00 19:44:00 20:48:00 21:52:00 22:56:00
Relative humidity/% Time
21st 22nd
Blackbody emissivity: Even a small deviation from unity results in tens (or even hundreds) of mK of change in the measured radiance temperature of the blackbody. Emissivity depends on the cavity coating, shape of the cavity and cavity aperture. The BB emissivity must be calculated (or measured?) and the “temperature error” introduced by the non-unity emissivity estimated. This “error” should be used as a correction to the temperature measured by the PRT, e.g. changing the emissivity of a BB at 30°C from 0.9993 to 0.9999 changes the radiance temperature by 50mK! The appropriate uncertainty contribution due to emissivity should be added in the uncertainty budget.
Consider the position of thermometer relative to cavity. Does it represent the temperature of the inside of the cavity? If not, then the temperature drop due to thermal resistance between thermometer position and inside of the cavity should be estimated. One of our Ga reference blackbodies suffers from a 22 mK temperature drop! Correction/uncertainty due to radiative heating/cooling of the blackbody cavity to the environment (small for BBs operating at ambient temperatures, but significant at other temperatures). Correction/uncertainty due to convection heating/cooling of the blackbody cavity to the environment (small for BBs operating at ambient temperatures). Cavity temperature uniformity: Uncertainty due to the temperature variation within the blackbody cavity. Stability of the blackbody temperature.
Measurement Laboratory Results: Blackbody Comparison
Measurement Laboratory Results: Blackbody Comparison
Instrument Type ...…… …………………………. Identification No …………………………. Date of measurement: …………………………… Ambient temperature ……………………. Time of measurement (UTC) Blackbody Brightness Temperature BB Brightness Temperature Uncertainty Uncertainty K mK A % B Participant: …………………………………………………………………………………… Signature: …………………………….. Date: ……………………………
Measurement Laboratory Results: Radiometer Comparison
Instrument Type ...…… …………………………. Identification No …………………………. Date of measurement: …………………………… Ambient temperature ……………………. Time of measurement (UTC) Measured Brightness Temperature Combined Measurement Uncertainty Wave- length Band- width Uncertainty No.
K mK m nm A % B Runs Participant: …………………………………………………………………………………… Signature: …………………………….. Date: ……………………………
Uncertainty Contribution Type A Uncertainty in Value / % Type B Uncertainty in Value / (appropriate units) Uncertainty in Brightness temperature K Repeatability of measurement Reproducibility of measurement Primary calibration Linearity of radiometer Drift since calibration Ambient temperature fluctuations Size-of-Source Effect Atmospheric absorption/emission URepeat URepro UPrim ULin UDrift Uamb USoS Uatm URepeat URepro UPrim ULin UDrift Uamb USoS Uatm RMS total ((Urepeat)2+(URepro)2))½
Parameter Type A Uncertainty in Value / % Type B Uncertainty in Value / (appropriate units) Uncertainty in Brightness temperature K Repeatability of measurement Reproducibility of measurement Blackbody emissivity BB Thermometer Calibration BB cavity temperature non- uniformity BB temperature stability Reflected ambient radiation Radiant heat/loss gain Convective heat/loss gain Primary Source URepeat URepro Uemis Utherm UUnif Ustab URefl URadiant UConvect UPrim URepeat URepro Uemis Utherm UUnif Ustab URefl URadiant UConvect UPrim RMS total ((uRepeat)2+(uRepro)2 )½
WST Measurement Results at Wraysbury Reservoir
Instrument Type ...………… Identification Number ……… Ambient temperature ………… Date of measurement: …………………… View angle from nadir (degrees)……………… Wavelength (µm) …………………………… Bandwidth (µm) ……………………………. Time (UTC) Measured WST Combined WST Uncertainty Measured sky temperature
sky temperature Uncertainty No.
K K K K A % B Runs Participant: …………………………………………………………………………………… Signature: …………………………….. Date: ……………………………
Uncertainty Contribution Type A Uncertainty in Value / % Type B Uncertainty in Value / (appropriate units) Uncertainty in Brightness temperature K Repeatability of measurement Reproducibility of measurement Primary calibration Water emissivity Water surface “roughness” Angle of view to nadir Linearity of radiometer Drift since last calibration Ambient temperature fluctuations Atmospheric absorption/emission URepeat URepro UPrim Uemiss Urough Uangle ULin UDrift Uamb Uatm URepeat URepro UPrim Uemiss Urough Uangle ULin UDrift Uamb Uatm RMS total ((Urepeat)2+(URepro)2))½
Footer