
SLIDE 1
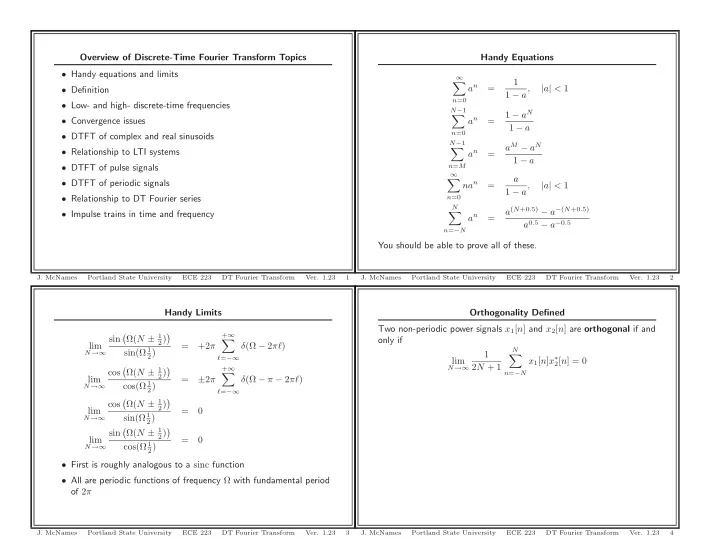
Handy Limits lim
N→∞
sin
- Ω(N ± 1
2)
- sin(Ω 1
2)
= +2π
+∞
- ℓ=−∞
δ(Ω − 2πℓ) lim
N→∞
cos
- Ω(N ± 1
2)
- cos(Ω 1
2)
= ±2π
+∞
- ℓ=−∞
δ(Ω − π − 2πℓ) lim
N→∞
cos
- Ω(N ± 1
2)
- sin(Ω 1
2)
= lim
N→∞
sin
- Ω(N ± 1
2)
- cos(Ω 1
2)
=
- First is roughly analogous to a sinc function
- All are periodic functions of frequency Ω with fundamental period
- f 2π
- J. McNames
Portland State University ECE 223 DT Fourier Transform
- Ver. 1.23
3
Overview of Discrete-Time Fourier Transform Topics
- Handy equations and limits
- Definition
- Low- and high- discrete-time frequencies
- Convergence issues
- DTFT of complex and real sinusoids
- Relationship to LTI systems
- DTFT of pulse signals
- DTFT of periodic signals
- Relationship to DT Fourier series
- Impulse trains in time and frequency
- J. McNames
Portland State University ECE 223 DT Fourier Transform
- Ver. 1.23
1
Orthogonality Defined Two non-periodic power signals x1[n] and x2[n] are orthogonal if and
- nly if
lim
N→∞
1 2N + 1
N
- n=−N
x1[n]x∗
2[n] = 0
- J. McNames
Portland State University ECE 223 DT Fourier Transform
- Ver. 1.23
4
Handy Equations
∞
- n=0
an = 1 1 − a, |a| < 1
N−1
- n=0
an = 1 − aN 1 − a
N−1
- n=M
an = aM − aN 1 − a
∞
- n=0
nan = a 1 − a, |a| < 1
N
- n=−N
an = a(N+0.5) − a−(N+0.5) a0.5 − a−0.5 You should be able to prove all of these.
- J. McNames
Portland State University ECE 223 DT Fourier Transform
- Ver. 1.23