
SLIDE 1
Overfitting Can Happen Overfitting Can Happen Overfitting Can - - PowerPoint PPT Presentation
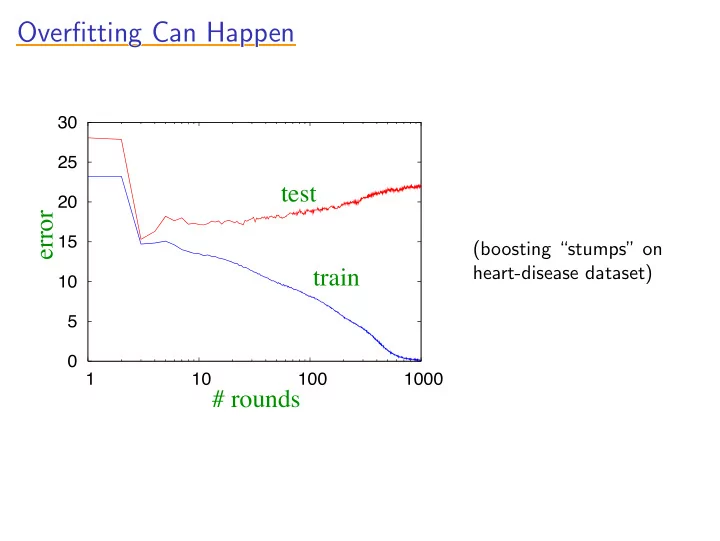
Overfitting Can Happen Overfitting Can Happen Overfitting Can Happen Overfitting Can Happen Overfitting Can Happen 30 25 test 20 error 15 (boosting stumps on heart-disease dataset) train 10 5 0 1 10 100 1000 # rounds
10 100 1000 5 10 15 20
0.5 1 0.5 1.0