Outline of Consolidated Results for the Three Months Ended June 30, - - PDF document

outline of consolidated results for the three months
SMART_READER_LITE
LIVE PREVIEW

Outline of Consolidated Results for the Three Months Ended June 30, - - PDF document

Outline of Consolidated Results for the Three Months Ended June 30, 2015 ( April 1, 2015 to June 30, 2015 ) 1. Operating Results Billions of yen Consolidated Year-on-year change Three Months ended Three Months ended June 30, 2015 June 30,


slide-1
SLIDE 1

13

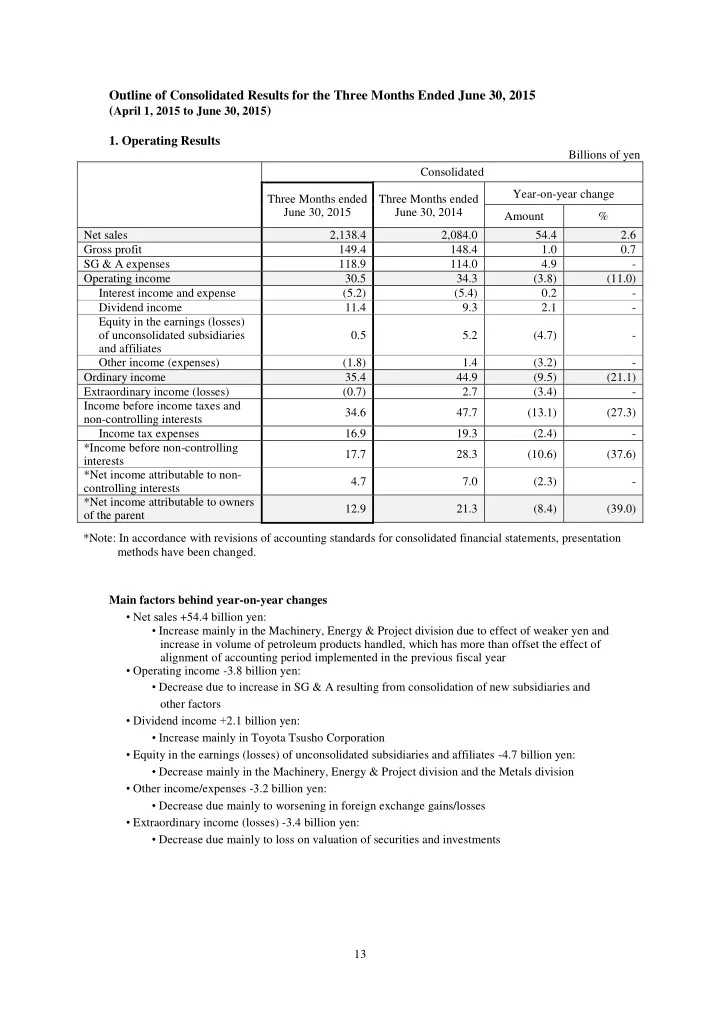
Outline of Consolidated Results for the Three Months Ended June 30, 2015 (April 1, 2015 to June 30, 2015)

  • 1. Operating Results

Billions of yen Consolidated Three Months ended June 30, 2015 Three Months ended June 30, 2014 Year-on-year change Amount % Net sales 2,138.4 2,084.0 54.4 2.6 Gross profit 149.4 148.4 1.0 0.7 SG & A expenses 118.9 114.0 4.9

  • Operating income

30.5 34.3 (3.8) (11.0) Interest income and expense (5.2) (5.4) 0.2

  • Dividend income

11.4 9.3 2.1

  • Equity in the earnings (losses)
  • f unconsolidated subsidiaries

and affiliates 0.5 5.2 (4.7)

  • Other income (expenses)

(1.8) 1.4 (3.2)

  • Ordinary income

35.4 44.9 (9.5) (21.1) Extraordinary income (losses) (0.7) 2.7 (3.4)

  • Income before income taxes and

non-controlling interests 34.6 47.7 (13.1) (27.3) Income tax expenses 16.9 19.3 (2.4)

  • *Income before non-controlling

interests 17.7 28.3 (10.6) (37.6) *Net income attributable to non- controlling interests 4.7 7.0 (2.3)

  • *Net income attributable to owners
  • f the parent

12.9 21.3 (8.4) (39.0) *Note: In accordance with revisions of accounting standards for consolidated financial statements, presentation methods have been changed. Main factors behind year-on-year changes

  • Net sales +54.4 billion yen:
  • Increase mainly in the Machinery, Energy & Project division due to effect of weaker yen and

increase in volume of petroleum products handled, which has more than offset the effect of alignment of accounting period implemented in the previous fiscal year

  • Operating income -3.8 billion yen:
  • Decrease due to increase in SG & A resulting from consolidation of new subsidiaries and
  • ther factors
  • Dividend income +2.1 billion yen:
  • Increase mainly in Toyota Tsusho Corporation
  • Equity in the earnings (losses) of unconsolidated subsidiaries and affiliates -4.7 billion yen:
  • Decrease mainly in the Machinery, Energy & Project division and the Metals division
  • Other income/expenses -3.2 billion yen:
  • Decrease due mainly to worsening in foreign exchange gains/losses
  • Extraordinary income (losses) -3.4 billion yen:
  • Decrease due mainly to loss on valuation of securities and investments
slide-2
SLIDE 2

14

  • 2. Financial Position

Billions of yen Consolidated As of June 30, 2015 As of March 31, 2015 Change versus March 31, 2015 Amount % Total assets 4,571.7 4,533.6 38.1 0.8 Current assets 2,792.5 2,769.2 23.3 0.8 Investment securities &

  • ther investments

619.0 632.9 (13.9) (2.2) Other fixed assets 1,160.1 1,131.4 28.7 2.5 Net assets 1,281.2 1,304.4 (23.2) (1.8) Net interest-bearing debt 1,276.1 1,233.5 42.6 3.4 Debt-equity ratio (times) 1.2 1.1 0.1 Main factors behind year-on-year changes

  • Current assets +23.3 billion yen:
  • Trade notes and accounts receivable increased 38.3 billion yen
  • Investment securities & other investments -13.9 billion yen:
  • Decrease due mainly to effect of newly consolidated subsidiaries
  • Other fixed assets +28.7 billion yen:
  • Property and equipment increased 33.8 billion yen
  • Net assets -23.2 billion yen:
  • Retained earnings increased 2.5 billion yen (Net income attributable to owners of the parent of

12.9 billion yen less 9.8 billion yen dividends, etc.)

  • Net unrealized gains on available-for-sales securities, net of taxes increased 9.6 billion yen
  • Foreign currency translation adjustments decreased 29.8 billion yen
  • Deferred gain (loss) on futures hedge decreased 3.2 billion yen
  • 3. Consolidated Net Sales and Operating Income by Segment

*The top row for each segment indicates net sales; the bottom row indicates operating income. Billions of yen Three Months ended June 30, 2015 Three Months ended June 30, 2014 Year-on-year change Amounts affected by exchange rates Year-on-year change excluding amount affected by exchange rates Amount % Metals 471.2 498.9 (27.7) 40.4 (68.1) (12.6) 9.6 10.1 (0.5) 1.3 (1.8) (16.4) Global Parts & Logistics 250.5 244.4 6.1 33.9 (27.8) (10.0) 5.8 4.7 1.1 0.7 0.4 5.9 Automotive 320.1 348.7 (28.6) 0.2 (28.8) (8.3) 8.2 8.2 0.0 0.6 (0.6) (6.4) Machinery, Energy & Project 460.7 394.3 66.4 27.1 39.3 9.3 5.7 4.4 1.3 0.2 1.1 23.8 Chemicals & Electronics 495.0 476.3 18.7 31.2 (12.5) (2.5) 3.1 7.0 (3.9) 0.5 (4.4) (58.1) Food & Agribusiness 104.1 85.3 18.8 7.1 11.7 12.6 (0.1) 1.3 (1.4) (0.1) (1.3) (109.4) Consumer Products & Services 35.8 35.2 0.6 0.9 (0.3) (0.7) 1.0 0.5 0.5 0.0 0.5 74.4 Total 2,138.4 2,084.0 54.4 140.8 (86.4) (3.9) 30.5 34.3 (3.8) 3.2 (7.0) (18.6)

slide-3
SLIDE 3

15 Main factors behind year-on-year changes

  • Metals

Net sales: Decreased due to effect of alignment of accounting period implemented in the previous fiscal year Operating income: Decreased due to lower market value

  • Global Parts & Logistics

Net sales: Decreased due to effect of alignment of accounting period implemented in the previous fiscal year Operating income: Increased due to increase in automobile production in North America

  • Automotive

Net sales and operating income: Both decreased due to effect of alignment of accounting period implemented in the previous fiscal year

  • Machinery, Energy & Project

Net sales: Increased due to increase in trading volume of petroleum products Operating income: Increased due to increase in trading volume of automotive equipment

  • Chemicals & Electronics

Net sales: Decreased due to effect of alignment of accounting period implemented in the previous fiscal year Operating income: Decreased due to loss on valuation of inventories

  • Food & Agribusiness

Net sales: Increased due to increase in trading volume of grain handled overseas Operating income: Decreased due to lower profitability of grain imported or handled overseas

  • Consumer Products & Services

Net sales: Almost unchanged from the previous corresponding period Operating income: Increased due to higher profitability of textile-related products

  • 4. Consolidated Financial Results Forecasts for the Year Ending March 31, 2016

(April 1, 2015 to March 31, 2016)

Billions of yen Year ending March 31, 2016 (forecast) Year ended March 31, 2015 (results) Year-on-year change Amount % Net sales 8,400.0 8,663.4 (263.4) (3.0) Operating income 158.0 169.4 (11.4) (6.8) Ordinary income 158.0 156.2 1.8 1.1 Net income attributable to

  • wners of the parent

70.0 67.5 2.5 3.6

slide-4
SLIDE 4

16

  • 5. Changes in Major Indexes

Three Months ended June 30, 2015 Three Months ended June 30, 2014 (or as of March 31, 2015) Exchange rate (yen / US dollar) Average during the period 121 102 End of period 122 (120) Interest rate Yen TIBOR 3M average 0.17% 0.21% US dollar LIBOR 3M average 0.28% 0.23% Dubai oil (US dollars / bbl) 61 105 Australian thermal coal (US dollars / ton) 60 73 Corn futures (cents / bushel) 366 479