
SLIDE 1
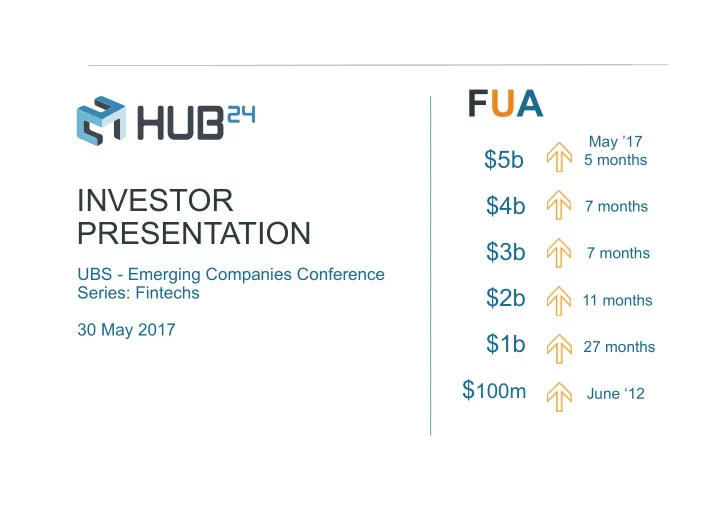
INVESTOR PRESENTATION
FUA
May ’17 5 months 7 months
$5b $4b $3b
7 months
$2b
11 months
$1b
27 months
UBS - Emerging Companies Conference Series: Fintechs 30 May 2017
$100m
June ‘12
FUA May 17 $5b 5 months INVESTOR $4b 7 months PRESENTATION - - PowerPoint PPT Presentation
FUA May 17 $5b 5 months INVESTOR $4b 7 months PRESENTATION $3b 7 months UBS - Emerging Companies Conference Series: Fintechs $2b 11 months 30 May 2017 $1b 27 months $ 100m June 12 2 Overview 4 7 13 19 20 1HFY17
May ’17 5 months 7 months
7 months
11 months
27 months
UBS - Emerging Companies Conference Series: Fintechs 30 May 2017
June ‘12
2
4
1HFY17 highlights
7 13 19 20
Opportunities for growth Financial results Outlook Appendix A – Corporate
HUB24 IS A LEADER IN WEALTH MANAGEMENT PLATFORMS UNDERPINNED BY MARKET LEADING TECHNOLOGY
3 The fastest growing wrap platform1 capitalising on significant disruption in the wealth management industry Now profitable and Funds Under Administration (FUA) of $5.05b (as at 26 May 2017) Margin expansion occurring at increasing scale Includes Paragem (Licensee with a national adviser network) which advises on client funds of
Acquisition of Agility Applications (specialist provider of technology and application products to the financial services industry)
1. Source: Plan For Life. Analysis of Wrap, Platform and Master Trust Managed Funds at December 2016. HUB24 is the fastest growing wrap platform relative to its size in percentage terms, 7th fastest in dollar terms of net inflows. 2. Results from Investment Trends December 2016 Platform Competitive Analysis and Benchmarking Report based on extensive analyst reviews of 19 platforms across 526 functional points.
Best managed accounts platform2 Fastest growing platform1
PLATFORM REVENUE AND RETAIL FUA
FUA $M Revenue $M
4 Yr CAGR of FUA 101% 4 Yr CAGR of Revenue 134% ‐ 2 4 6 8 10 12 14 ‐ 500 1,000 1,500 2,000 2,500 3,000 3,500 4,000 4,500 1HFY13 2HFY13 1HFY14 2HFY14 1HFY15 2HFY15 1HFY16 2HFY16 1HFY17 Revenue FUA
4
First reporting period of profitability
4
3. Results from Investment Trends December 2016 Platform Competitive Analysis and Benchmarking Report based on extensive analyst reviews of 19 platforms across 526 functional points. 4. EBITDA represents earnings before interest, tax, depreciation, amortisation and other significant items. 5. Represents Net Profit After Tax excluding non-recurring items
Acquisition of
Agility Applications
Positive operating cashflows of
$1.5m
Launch
international shares across 15 exchanges
1st
in categories for Managed Accounts, User Interface and Smartphone/Tablet Access3
Increase in Operating EBITDA of
240%
EBITDA4 of $1.7m Underlying NPAT5 of $0.9m
Netflows of
$694m
FUA Increase of 25% since 30 June 2016, now $5.05b
5
Other significant items reported in NPAT include interest, share based payments, non-recurring corporate costs, amortisation and tax expense. (refer Appendix B) 6. Growth resources expensed are costs for platform development, strategic development and to accelerate additional FUA onto the platform 7. EBITDA represents earnings before interest, tax, depreciation, amortisation and other significant items 8. Represents Net Profit After Tax excluding non-recurring items.
GROUP FINANCIAL RESULTS 1HFY17 $m 1HFY16 $m % CHANGE Group revenue 26.6 20.0 33% Direct costs (18.4) (15.2) 21% Gross profit 8.3 4.8 73% Operating expenses (4.2) (3.6) 16% Operating EBITDA 4.1 1.2 240% Growth resources expensed6 (2.4) (2.1) 12% EBITDA7 before other significant items 1.7 (0.9)
1.5 (1.7)
1.3 (1.8)
0.9 (1.6)
RESULTS 1HFY17 $m 1HFY16 $m % CHANGE Retail FUA (now $5.05b) $4,149 $2,368 75% Revenue 11.8 6.9 70% Direct costs (4.8) (3.3) 48% Gross profit 7.0 3.7 89% Operating expenses (2.8) (2.4) 19% Operating EBITDA 4.2 1.3 215% Growth resources expensed6 (2.3) (2.1) 12% EBITDA7 before other significant items 1.9 (0.7)
1.9 (0.6)
1.6 (0.8)
MARGIN EXPANSION ACROSS ALL PROFIT LINES AT INCREASING SCALE
6
1HFY17 Vs 1HFY16 Revenue increase – 70% Direct & operating expense increase – 36%
PLATFORM – REVENUE, GROSS PROFIT, OPERATING EBITDA9 AND EBITDA10 TRENDS
PLATFORM REVENUE AND EXPENSES
9. Operating EBITDA represents earnings before interest, tax, depreciation, amortisation, growth resources expensed and other significant items 10. EBITDA represents earnings before interest, tax, depreciation, amortisation and other significant items
(4) (2) 2 4 6 8 10 12 14
1HFY15 2HFY15 1HFY16 2HFY16 1HFY17
Revenue Gross Profit Operating EBITDA EBITDA
$‘M
PLATFORM PROFIT LINES PROFIT MARGINS AS A % OF REVENUE 1HFY15 2HFY15 1HFY16 2HFY16 1HFY17 Gross profit 32.3% 43.8% 53.1% 57.7% 59.2% Operating EBITDA (17.3%) 7.5% 19.1% 29.4% 35.4% EBITDA (73.5%) (35.0%) (10.6%) 1.9% 15.8% ‐ 2 4 6 8 10 12 14 1HFY15 2HFY15 1HFY16 2HFY16 1HFY17 Revenue Direct & operating expenses
7
Sector Predicting By Year CAGR Superannuation assets $9.5 tn 2035 8.1%
Deloitte Dynamics of Superannuation Report 2015
Wrap Platforms $315 bn 2030 10.4%
Rice Warner’s Personal Investment Market Projections Report 2015.
Managed portfolio (SMAs) $60 bn 2020 32%
Morgan Stanley Research Asia Insight June 22, 2016. Disruptors: Australia Financials
11. Rice Warner’s Personal Investment Market Projections Report 2015. 12. Morgan Stanley Research Asia Insight June 22, 2016. Disruptors: Australia Financials 13. Source: Plan For Life. Analysis of Wrap, Platform and Master Trust Managed Funds at December 2016
INDUSTRY GROWTH FORECASTS
Wrap platforms: fourfold increase next 15 years
the fastest growing personal investment sector11
Managed portfolios
in which HUB24 is a market leader, could account for 75% of platform net inflows12
Abundant room for growth
HUB24 has 0.57% market share13 with fastest FUA growth rate at CAGR of 101% over the past 4 years
disruption from managed accounts/SMAs
solution delivering higher flows and market share to modern industry players.
customer, managed portfolios are altering the traditional value chain
financial planners seeking to grow revenue and the value of their practices and investors seeking greater transparency, professional management and tax efficiency.
MORGAN STANLEY RESEARCH HAS REVEALED THAT: Award winning
and ranked ahead of all incumbent institutional platforms in terms of platform functionality
MARKET SHARE BY NETFLOWS – TOP 10 PLATFORMS14
8
14. Source: Plan For Life. Analysis of Wrap, Platform and Master Trust Managed Funds at December 2016. HUB24 is the fastest growing wrap platform relative to its size in percentage terms, 7th fastest in dollar terms of net inflows.
HUB24 has 0.57% share of Wrap, Platform & Master Trusts at 31 Dec ‘16 with 11.57% share of netflows Non-institutional platforms (disruptors) account for 2.9% of FUA and 30% of netflows Highest growth rate in % terms, 7th in $ terms
0% 2% 4% 6% 8% 10% 12% 14% 16% 18% 20% 1 2 3 4 5 6 HUB24 8 9 10
FUA Annual net flows
HUB24 achieves 11.57% of market flows with a current market share of 0.57%
FUA AND NUMBER OF ADVISERS
27 new licensees signed in 1HFY17 Ongoing growth in adviser numbers Increasing platform usage by advisers Further increases expected given currently low share of the typical adviser’s average FUA $M # Advisers
Platforms ranked by market share of netflows
Platform ranking by netflows Netflow mkt share 0.00 1.00 2.00 3.00 4.00 5.00 6.00 7.00 100 200 300 400 500 600 700 800 900 Sep‐13 Dec‐13 Mar‐14 Jun‐14 Sep‐14 Dec‐14 Mar‐15 Jun‐15 Sep‐15 Dec‐15 Mar‐16 Jun‐16 Sep‐16 Dec‐16 Mar‐17 # of Advisers Average FUA per adviser
9
10
Agility Applications (‘Agility’) is a successful specialist technology services provider to the financial services industry, particularly stock brokers Licensing over 2,300 users from within 165 firms, reporting on over $200 billion of client assets A strategic acquisition supporting the convergence of traditional stockbroking and financial planning sectors into holistic wealth management providers HUB24 together with Agility aims to be the leading provider of wealth management platform and financial technology services in Australia
AGILITY CONNECT BANKS EXECUTION & CLEARING SERVICE PROVIDERS TRADING PARTICIPANTS (BROKERS) PLATFORMS & VENDORS ASX CHI‐X BACK‐OFFICE SETTLEMENT SYSTEMS MARGIN LENDERS
KEY FEATURES THAT SET HUB24 APART INCLUDE: Depth of managed portfolio functionality, now including IMAs Tax optimisation features & portfolio construction tools International managed portfolios across 15 major exchanges traded daily Delivery across multiple legal structures – IDPS, Super, MDA, Wholesale, Reporting Services Unique proprietary technology with ongoing innovation Industry leading team with compelling experience 11
HUB24 OFFERS THE MOST FUNCTIONAL MANAGED PORTFOLIO TECHNOLOGY WITHIN A FULL SERVICE PLATFORM
Enablinglicensees to innovate, improve revenues and manage risk Helpingadvisers to efficiently improve their value proposition and profitability Making a real difference for
investors by
supporting better financial
transparency and flexibility
12
…and now creating value for
brokers and high net worth
advisory businesses through
Launch of 2 new white labels in Q1 2017 A further new white label agreement signed in late February New product enhancements including direct international equities The acquisition of Agility Applications will enable increased engagement with the broker segment through integration of Agility Connect with AdviserHUB With our unique open application interfaces HUB24 can integrate with any technology providing access to ‘best of breed’ solutions and fitting seamlessly into adviser and licensee business models In 1HFY17 we have launched 45 new managed portfolios for 12 licensees allowing them to access new revenue streams, mitigating licensee risk and more importantly providing modern investment solutions delivering real financial advantages for clients
13
14
Compliance, facilities, marketing, IT infrastructure and professional services
Trustee, administration and transaction services for Platform and adviser remuneration for Licensee Costs for platform development, strategic development and other costs to accelerate FUA onto the platform
GROUP FINANCIAL RESULTS 1HFY17 $m 1HFY16 $m % CHANGE Group revenue 26.6 20.0 33% Direct costs (18.4) (15.2) 21% Gross profit 8.3 4.8 73% Operating expenses (4.2) (3.6) 16% Operating EBITDA 4.1 1.2 240% Growth resources expensed15 (2.4) (2.1) 12% EBITDA16 before other significant items 1.7 (0.9)
1.5 (1.7)
1.3 (1.8)
0.9 (1.6)
segments ($14.4m)
First reporting period where all profit lines are positive – reflecting the benefits of growth and scalability
Due diligence costs for Agility acquisition and fair value adjustment for deferred contingent consideration (Paragem).
Other significant items reported in NPAT include interest, share based payments, non-recurring corporate costs, amortisation and tax expense. (refer Appendix B) 15. Growth resources expensed are costs for platform development, strategic development (inclusive of M&A activity) and to accelerate additional FUA onto the platform 16. EBITDA represents earnings before interest, tax, depreciation, amortisation and other significant items 17. Represents Net Profit After Tax excluding non-recurring items.
GROUP FINANCIAL RESULTS 1HFY17 $m 1HFY16 $m % CHANGE Retail FUA (now $5,050m) $4,149 $2,368 75% Revenue 11.8 6.9 70% Direct costs (4.8) (3.3) 48% Gross profit 7.0 3.7 89%
% 59% 53% 11%
Operating expenses (2.8) (2.4) 19% Operating EBITDA 4.2 1.3 215%
% 35% 19% 86%
Growth resources expensed18 (2.3) (2.1) 12% EBITDA19 before other significant items 1.9 (0.7)
16% (11%) 249%
EBITDA 1.9 (0.6)
1.6 (0.8)
(7.6) (5.7) 36%
15
Gross profit growth driven by improved margins from increased scale.
EBITDA margin continues to expand with increasing scale Revenue growth driven by net inflows from a broadening client base
Other significant items reported in PBT include interest, share based payments, non-recurring corporate costs, amortisation and tax expense. (refer Appendix B) 18. Growth resources expensed are costs for platform development, strategic development and to accelerate additional FUA onto the platform 19. EBITDA represents earnings before interest, tax, depreciation and amortisation and other significant items
Investment in fixed cost base to support consistent growth consistent with long term trend between 15% to 20% p.a. Strong investment continues with an increase in development capex to $0.96m for the half year
Continuing robust investment in the platform rewarded with FUA growth, industry recognition and expanding profit margins
16
1HFY17 $M INCREASE ON PCP Retail FUA (now $5.05b) 4,149 75% Net inflows 694 4% Gross inflows 971 21% Number of advisers 737 33%
AVERAGE MONTHLY NET INFLOWS (‘m) BROADENING
distribution base with 92 active licensees 12 white labels 27 new licensees to the platform in FY17 2 New White labels to be launched in Mar ‘17, one new white label signed in February
NOW OFFERING
international direct shares international managed portfolios interfaces for online account opening for any system
DELIVERING
across multiple legal structures IDPS Super MDA Wholesale Reporting service
20 40 60 80 100 120 140 160 FY12 FY13 FY14 FY15 FY16 YTDFY17
LICENSEE FINANCIAL RESULTS 1HFY17 $M 1HFY16 $M % CHANGE Revenue 14.8 13.1 13% Direct costs (13.5) (12.0) 13% Gross profit 1.3 1.1 17% Operating expenses (1.2) (1.0) 12% EBITDA 0.1 0.1
0.1 0.1
Licensee now has more than $3.25b in funds under advice Recruitment of several new practices is well progressed Revenue increase of 13% over prior corresponding period Further investment options introduced to the HUB platform for Paragem advisers
CORPORATE SEGMENT RESULTS 1HFY17 $M 1HFY16 $M % CHANGE Operating expenses (0.19) (0.17) 11% Growth resources expensed (0.06) (0.06) 3%
EBITDA
before other significant items
(0.25) (0.23) 9% Fair value gain – contingent consideration 0.48
Share based payments (0.34) (0.68) (50%) Non-recurring corporate costs (0.40) (0.26) 55%
EBITDA20
(0.52) (1.17) 56% Interest 0.12 0.12
(0.40) (1.05) 38% Tax
NPAT (0.40) (1.05) (43%)
18
Corporate overhead expenses allocated to the corporate segment Issue of options during the half year offset by contingent consideration adjustment of $319k regarding Paragem earnout Non-recurring corporate advisory, tax, legal and transaction costs, including the evaluation of potential business
Tax expense for the half offset by previously unused tax losses
Other significant items reported in NPAT include interest, share based payments, transaction costs, amortisation and tax expense. (refer Appendix B) 20. EBITDA represents earnings before interest, tax, depreciation and amortisation and other significant items
Fair value gain - Contingent consideration of $476k due to revised estimate for Paragem earnout
19
Continued strong FUA growth expected Increasing distribution footprint by accessing current adviser relationships and targeting new Extend industry leadership position through product innovation Pursue appropriate and value accretive corporate activity & strengthening profitability Continue to leverage industry dynamics Integration of Agility acquisition Growing our investment in:
BALANCE SHEET AS AT 31 DECEMBER ‘16 Cash and cash equivalents $10.45m Other current assets $6.00m Non-current assets $14.70m Total assets $31.15m Current liabilities $8.09m Non-current liabilities $1.30m Total liabilities $9.39m Net assets $21.76m Equity $21.76m
20
CAPITAL STRUCTURE AT 24 FEBRUARY ‘17 Shares on issue 53.9m Share price $4.49 Market capitalisation $242m Unused tax losses $13.40m SUBSTANTIAL SHAREHOLDERS Thorney Holdings Ltd 17.73% Acorn Capital Ltd 10.52% Commonwealth Bank of Australia 7.03% Ian Litster 6.78%
2 Year share price history
SUMMARY INFORMATION The material herein is a presentation of general background information about HUB24 Limited’s (‘HUB’) activities current as at date of presentation. This information given in summary form does not purport to be complete and should be read in conjunction with previous ASX filings, Half Year Report and the audited Annual Report as applicable. NOT INVESTMENT ADVICE This presentation is not a prospectus or a product disclosure statement under the Corporations Act 2001 (Cth) and has not been lodged with ASIC. The information provided in this presentation is not intended to be relied upon as advice to investors or potential investors and does not take into account the investment objectives, financial situation or needs of any particular investor. These should be considered, with or without professional advice when deciding if an investment is appropriate. RISK OF INVESTMENT An investment in HUB shares is subject to investment and other known and unknown risks, some of which are beyond the control of
performance of HUB nor does it guarantee the repayment of capital from HUB or any particular tax treatment. FORWARD LOOKING STATEMENTS This presentation contains certain forward-looking statements. The words ‘anticipate’, ‘believe’, ‘expect’, ‘project’, forecast’, ‘estimate’, ‘intend’, ‘should’, ‘could’, ‘may’, ‘target’, ‘plan’ and other similar expressions are intended to identify forward-looking statements. Indications of, and guidance on, future earnings and financial position and performance are also forward-looking statements. Such forward-looking statements are not guarantees of future performance and involve known and unknown risks, uncertainties and other factors, many of which are beyond the control of HUB, that may cause actual results to differ materially from those expressed or implied in such statements. There can be no assurance that actual
not place reliance on forward-looking statements and neither HUB nor any of its directors, employees, consultants, contractors, advisers or agents assume any obligation to update such information.
21