Outline of Consolidated Results for the Nine Months ended December - - PDF document

outline of consolidated results for the nine months ended
SMART_READER_LITE
LIVE PREVIEW

Outline of Consolidated Results for the Nine Months ended December - - PDF document

Outline of Consolidated Results for the Nine Months ended December 31, 2016 ( April 1, 2016 to December 31, 2016 ) 1. Operating Results (Unit: Billions of yen) Consolidated Year-on-year change Nine Months ended Nine Months ended December 31,


slide-1
SLIDE 1

14

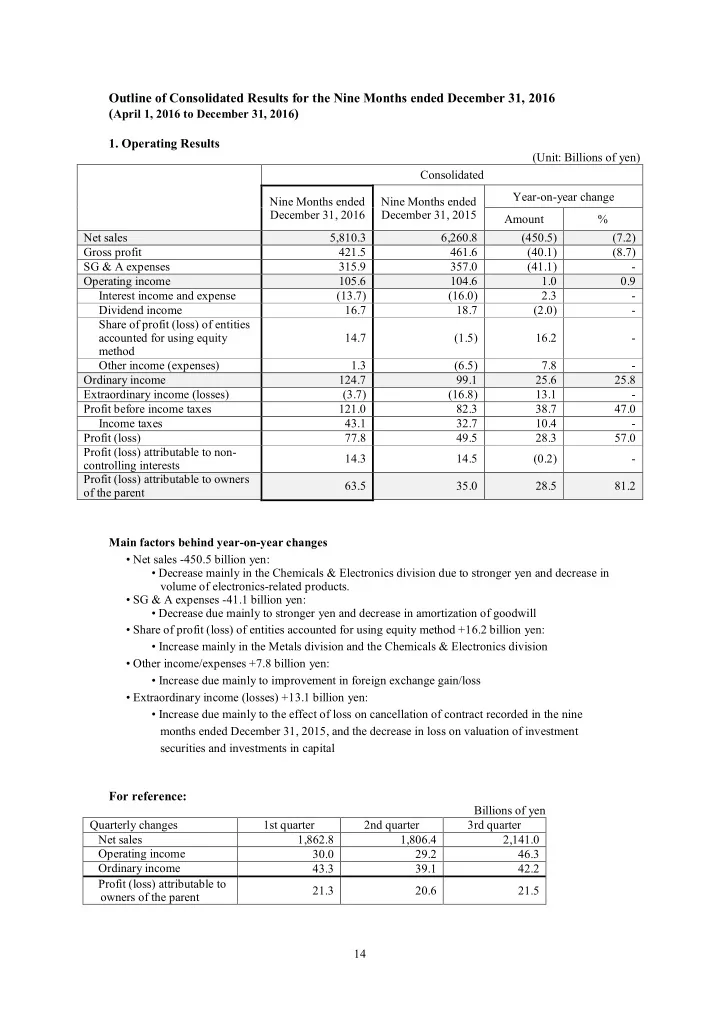
Outline of Consolidated Results for the Nine Months ended December 31, 2016 (April 1, 2016 to December 31, 2016)

  • 1. Operating Results

(Unit: Billions of yen) Consolidated Nine Months ended December 31, 2016 Nine Months ended December 31, 2015 Year-on-year change Amount % Net sales 5,810.3 6,260.8 (450.5) (7.2) Gross profit 421.5 461.6 (40.1) (8.7) SG & A expenses 315.9 357.0 (41.1)

  • Operating income

105.6 104.6 1.0 0.9 Interest income and expense (13.7) (16.0) 2.3

  • Dividend income

16.7 18.7 (2.0)

  • Share of profit (loss) of entities

accounted for using equity method 14.7 (1.5) 16.2

  • Other income (expenses)

1.3 (6.5) 7.8

  • Ordinary income

124.7 99.1 25.6 25.8 Extraordinary income (losses) (3.7) (16.8) 13.1

  • Profit before income taxes

121.0 82.3 38.7 47.0 Income taxes 43.1 32.7 10.4

  • Profit (loss)

77.8 49.5 28.3 57.0 Profit (loss) attributable to non- controlling interests 14.3 14.5 (0.2)

  • Profit (loss) attributable to owners
  • f the parent

63.5 35.0 28.5 81.2 Main factors behind year-on-year changes

  • Net sales -450.5 billion yen:
  • Decrease mainly in the Chemicals & Electronics division due to stronger yen and decrease in

volume of electronics-related products.

  • SG & A expenses -41.1 billion yen:
  • Decrease due mainly to stronger yen and decrease in amortization of goodwill
  • Share of profit (loss) of entities accounted for using equity method +16.2 billion yen:
  • Increase mainly in the Metals division and the Chemicals & Electronics division
  • Other income/expenses +7.8 billion yen:
  • Increase due mainly to improvement in foreign exchange gain/loss
  • Extraordinary income (losses) +13.1 billion yen:
  • Increase due mainly to the effect of loss on cancellation of contract recorded in the nine

months ended December 31, 2015, and the decrease in loss on valuation of investment securities and investments in capital For reference: Billions of yen Quarterly changes 1st quarter 2nd quarter 3rd quarter Net sales 1,862.8 1,806.4 2,141.0 Operating income 30.0 29.2 46.3 Ordinary income 43.3 39.1 42.2 Profit (loss) attributable to

  • wners of the parent

21.3 20.6 21.5

slide-2
SLIDE 2

15

  • 2. Financial Position

(Unit: Billions of yen) Consolidated As of December 31, 2016 As of March 31, 2016 Change versus March 31, 2016 Amount % Total assets 4,063.3 3,952.1 111.2 2.8 Current assets 2,551.0 2,425.8 125.2 5.2 Investment securities and investments in capital 566.4 530.9 35.5 6.7 Other non-current assets 945.8 995.2 (49.4) (5.0) Net assets 1,058.6 1,055.7 2.9 0.3 Net interest-bearing debt 1,085.7 1,102.7 (17.0) (1.5) Debt-equity ratio (times) 1.2 1.2 (0.0) Main factors behind year-on-year changes

  • Current assets +125.2 billion yen:
  • Cash and deposits increased 46.1 billion yen
  • Notes and accounts receivable - trade increased 71.1 billion yen
  • Investment securities and investments in capital +35.5 billion yen:
  • Increase due mainly to higher market value
  • Other non-current assets -49.4 billion yen:
  • Intangible assets decreased 52.5 billion yen
  • Net assets +2.9 billion yen:
  • Capital surplus decreased 3.1 billion yen
  • Retained earnings increased 41.3 billion yen (profit attributable to owners of the parent of 63.5

billion yen less 21.8 billion yen dividends, etc.)

  • Valuation difference on available-for-sale securities increased 30.4 billion yen
  • Foreign currency translation adjustment decreased 63.0 billion yen
  • 3. Cash Flow Position

(Unit: Billions of yen) Nine Months ended December 31, 2016 Nine Months ended December 31, 2015 Major factors behind year-on-year changes

  • 1. Cash flows from
  • perating activities

113.3 132.3 Profit for the nine months ended December 31, 2016

  • 2. Cash flows from

investing activities (83.3) (127.2) Purchase of property, plant and equipment 1-2: Free cash flow 30.0 5.1 Cash flows from financing activities 1.3 (56.1) Increase in loans payable

slide-3
SLIDE 3

16

  • 4. Consolidated Net Sales and Operating Income by Segment

*The top row for each segment indicates net sales; the bottom row indicates operating income. (Unit: Billions of yen) Nine Months ended December 31, 2016 Nine Months ended December 31, 2015 Year-on-year change Amounts affected by exchange rates Year-on-year change excluding amount affected by exchange rates Amount % Metals 1,253.8 1,393.1 (139.3) (96.8) (42.5) (3.3) 30.4 29.6 0.8 (2.8) 3.6 13.6 Global Parts & Logistics 701.5 748.9 (47.4) (95.6) 48.2 7.4 13.4 14.9 (1.5) (1.9) 0.4 2.7 Automotive 852.2 956.1 (103.9) (94.5) (9.4) (1.1) 19.6 26.1 (6.5) (3.5) (3.0) (13.4) Machinery, Energy & Project 1,353.6 1,237.3 116.3 (64.6) 180.9 15.4 13.2 16.3 (3.1) (0.3) (2.8) (17.3) Chemicals & Electronics 1,289.2 1,475.6 (186.4) (87.4) (99.0) (7.1) 27.1 18.8 8.3 (1.6) 9.9 57.2 *Food & Consumer Services 357.3 447.4 (90.1) (24.0) (66.1) (15.6) 7.8 6.8 1.0 (0.7) 1.7 26.8 Total 5,810.3 6,260.8 (450.5) (463.3) 12.8 0.2 105.6 104.6 1.0 (9.8) 10.8 11.3 Main factors behind year-on-year changes

  • Metals

Net sales: Decreased due to lower market price Operating income: Increased on the back of increase in automobile production which offset the effects of lower market price

  • Global Parts & Logistics

Net sales: Increased due to increase in automotive components handled overseas Operating income: Almost unchanged from the previous corresponding period as the increase in automotive components handled overseas was offset by foreign exchange loss included in non-operating category

  • Automotive

Net sales and operating income: Both decreased due to decrease in export by Toyota Tsusho Corporation as well as decrease in trading volume handled by overseas auto dealership

  • Machinery, Energy & Project

Net sales: Increased on the back of increase in trading volume of petroleum products Operating income: Decreased due to decrease in trading volume of automotive related facilities

  • Chemicals & Electronics

Net sales: Decreased due to decrease in trading volume of electronics-related products Operating income: Increased due to the effect of loss on valuation of inventories recorded in the nine months ended December 31, 2015 and decrease in amortization of goodwill

slide-4
SLIDE 4

17

  • Food & Consumer Services

Net sales: Decreased due to decrease in trading volume of grain handled overseas and lower market price Operating income: Increased due to decrease in amortization of goodwill * Effective April 1, 2016, the Food & Agribusiness Division and the Consumer Products & Services Division have been integrated into the Food & Consumer Services Division. In line with this, net sales and operating income for the nine months ended December 31, 2015 have been recast to reflect this change.

  • 5. Consolidated Financial Results Forecasts for the Year Ending March 31, 2017

(April 1, 2016 to March 31, 2017) *The top row for each segment indicates net sales; the bottom row indicates operating income. Billions of yen Year ending March 31, 2017 (revised forecast) Year ended March 31, 2016 (results) Year-on-year change (Reference) Year ending March 31, 2017 (previous forecast released on Oct. 28) Amount % Metals 1,700.0 1,817.4 (117.4) (6.5) 1,670.0 40.0 37.4 2.6 6.8 33.5 Global Parts & Logistics 950.0 999.0 (49.0) (4.9) 950.0 18.5 21.6 (3.1) (14.7) 17.5 Automotive 1,150.0 1,252.3 (102.3) (8.2) 1,050.0 26.0 37.9 (11.9) (31.5) 21.0 Machinery, Energy & Project 1,950.0 1,600.3 349.7 21.9 1,400.0 18.0 21.3 (3.3) (15.8) 19.0 Chemicals & Electronics 1,750.0 1,923.7 (173.7) (9.0) 1,720.0 35.0 24.9 10.1 40.3 35.0

Food & Consumer Services

500.0 574.2 (74.2) (12.9) 510.0 10.0 8.6 1.4 15.5 9.0 Total Net sales 8,000.0 8,170.2 (170.2) (2.1) 7,300.0 Operating income 145.0 140.2 4.8 3.4 130.0 Ordinary income 165.0 128.0 37.0 28.8 150.0 Profit (loss) attributable to owners of the parent 85.0 (43.7) 128.7

  • 70.0
  • 6. Dividend per share

Year ending March 31, 2017 (revised forecast) Year ending March 31, 2017 (previous forecast) Year ended March 31, 2016 Interim 31.0 yen 31.0 yen 31.0 yen Full year 70.0 yen 62.0 yen 62.0 yen Payout ratio (consolidated) Before amortization of goodwill 23.5% 23.9%

slide-5
SLIDE 5

18

  • 7. Changes in Major Indexes

Nine Months ended December 31, 2016 Nine Months ended December 31, 2015 (or as of March 31, 2016) Exchange rate (yen / US dollar) Average during the period 107 122 End of period 116 (113) Interest rate Yen TIBOR 3M average 0.06% 0.17% US dollar LIBOR 3M average 0.79% 0.33% Dubai oil (US dollars / bbl) 45 51 Corn futures (cents / bushel) 357 374