Consolidated Results of Kyocera Corporation and its Subsidiaries for - - PDF document

consolidated results of kyocera corporation and its
SMART_READER_LITE
LIVE PREVIEW

Consolidated Results of Kyocera Corporation and its Subsidiaries for - - PDF document

Consolidated Results of Kyocera Corporation and its Subsidiaries for the Three Months Ended June 30, 2007 The consolidated financial statements are prepared in conformity with accounting principles generally accepted in the United States of


slide-1
SLIDE 1

Consolidated Results of Kyocera Corporation and its Subsidiaries for the Three Months Ended June 30, 2007 The consolidated financial statements are prepared in conformity with accounting principles generally accepted in the United States

  • f America.
  • 1. Consolidated financial information for the three months ended June 30, 2007 :

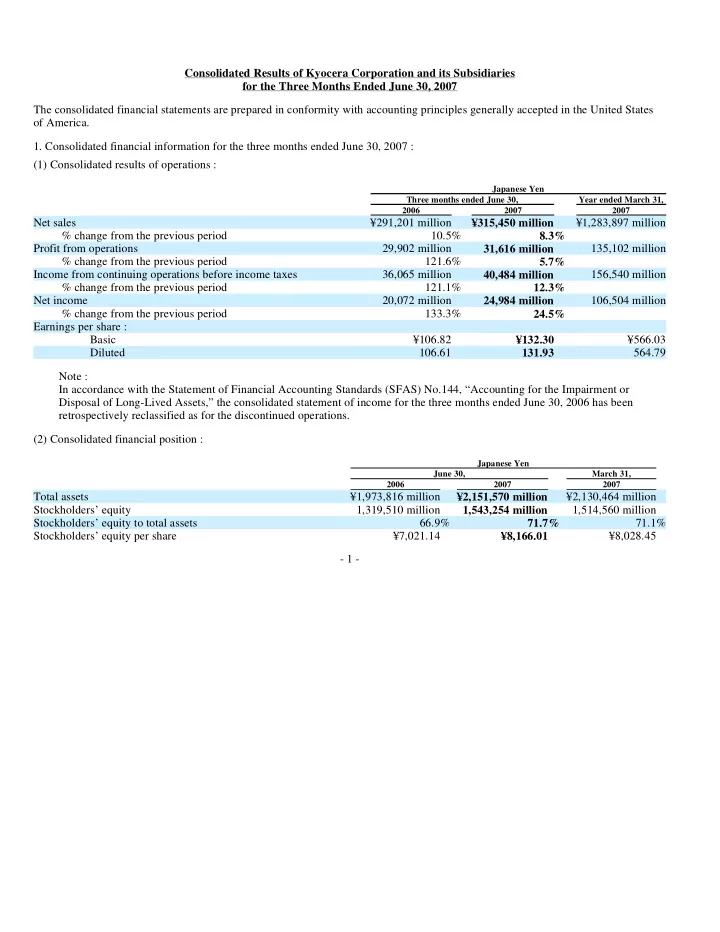
(1) Consolidated results of operations : Note : In accordance with the Statement of Financial Accounting Standards (SFAS) No.144, “Accounting for the Impairment or Disposal of Long-Lived Assets,” the consolidated statement of income for the three months ended June 30, 2006 has been retrospectively reclassified as for the discontinued operations. (2) Consolidated financial position :

  • 1 -

Japanese Yen Three months ended June 30, Year ended March 31, 2006 2007 2007

Net sales

¥291,201 million ¥315,450 million ¥1,283,897 million

% change from the previous period 10.5% 8.3% Profit from operations 29,902 million 31,616 million 135,102 million % change from the previous period 121.6% 5.7% Income from continuing operations before income taxes 36,065 million 40,484 million 156,540 million % change from the previous period 121.1% 12.3% Net income 20,072 million 24,984 million 106,504 million % change from the previous period 133.3% 24.5% Earnings per share : Basic ¥106.82 ¥132.30 ¥566.03 Diluted 106.61 131.93 564.79

Japanese Yen June 30, March 31, 2006 2007 2007

Total assets

¥1,973,816 million ¥2,151,570 million ¥2,130,464 million

Stockholders’ equity 1,319,510 million 1,543,254 million 1,514,560 million Stockholders’ equity to total assets 66.9% 71.7% 71.1% Stockholders’ equity per share ¥7,021.14 ¥8,166.01 ¥8,028.45

slide-2
SLIDE 2

(3) Consolidated cash flows :

  • 2. Consolidated financial forecast for the year ending March 31, 2008 :

Notes :

  • 1. There is no change in the above forecast for the year ending March 31, 2008 from the original forecast, which was shown in

the Form 6-K submitted on April 26, 2007.

  • 2. Forecast of earnings per share : ¥543.89

Net income per share amount is computed based on SFAS No.128. Forecast of earnings per share is computed based on the diluted average number of shares outstanding during the three months ended June 30, 2007. With regard to forecasts set forth above, please refer to the accompanying “Forward Looking Statements” on page 12.

  • 3. Change in accounting policies except due to new accounting standards : None
  • 2 -

Japanese Yen Three months ended June 30, Year ended March 31, 2006 2007 2007

Cash flows from operating activities ¥ 27,604 million ¥ 35,010 million ¥ 149,644 million Cash flows from investing activities (61,083) million (35,060) million (151,703) million Cash flows from financing activities 240 million (3,549) million (20,645) million Cash and cash equivalents at end of period 266,624 million 286,562 million 282,208 million

Japanese Yen Year ending March 31, 2008

Net sales ¥ 1,330,000 million % change from the year ended March 31, 2007 3.6% Profit from operations ¥ 151,000 million % change from the year ended March 31, 2007 11.8% Income before income taxes ¥ 166,000 million % change from the year ended March 31, 2007 6.0% Net income ¥ 103,000 million % change from the year ended March 31, 2007 (3.3)%

slide-3
SLIDE 3

Business Results, Financial Condition and Prospects

  • 1. Business Result for the Three Months Ended June 30, 2007

(1) Economic Situation and Business Environment Despite a lack of vitality in industrial production, the overall domestic economy during the three months ended June 30, 2007 (the first quarter) continued at a pace of moderate expansion, as evidenced by factors such as an increase in capital expenditures. At the same time, the U.S. economy grew steadily despite concerns over the impact of issues related to housing loans for consumers with low creditworthiness on personal consumption. Increases in exports and production led to growth in the European economy. In the digital consumer equipment market, which is the principal market for Kyocera Corporation and its consolidated subsidiaries (“Kyocera Group” or “Kyocera”), demand for passive components for such equipment expanded due to increased market strength compared with the three months ended June 30, 2006 (the previous first quarter). (2) Consolidated Financial Results Consolidated net sales for the first quarter amounted to ¥315,450 million, an increase of 8.3% compared with the previous first quarter, reflecting a substantial increase in sales in the Equipment Business and steady growth in sales in most of the Components Business. The Components Business recorded a decline in profit compared with the previous first quarter due primarily to a downturn in demand for semiconductor parts used in some imaging devices and automotive components for overseas markets together with the impact of an increase in depreciation costs. However, the Equipment Business posted a substantial increase in profit due mainly to improved profitability in the Telecommunications Equipment Group, which made up for a decline in profit in the Components

  • Business. As a result, profits for Kyocera Group as a whole increased, compared with the previous first quarter. Profit from operations

increased by 5.7% to ¥31,616 million compared with the previous first quarter. Income from continuing operations before income taxes increased by 12.3% to ¥40,484 million compared with the previous first quarter due to increases in interest and dividend income and equity in earnings of affiliates and unconsolidated subsidiaries. Net income increased by 24.5% to ¥24,984 million compared with the previous first quarter.

  • 3 -
slide-4
SLIDE 4

Note 1. Kyocera sold its shares in Kyocera Leasing Co., Ltd., a subsidiary engaged in financing services; as a result, business results for Kyocera Leasing Co., Ltd. for the previous first quarter have been recorded as income from discontinued operations in conformity with accounting principles generally accepted in the U.S. As a result, reclassified consolidated net sales for the previous first quarter decreased by ¥1,495 million compared with the result previously announced, reclassified profit from operations decreased by ¥740 million and income from continuing operations before income taxes for the previous first quarter decreased by ¥862 million, respectively. (3) Implemented Management Measures and Significant Decisions AVX Corporation (AVX), a U.S. subsidiary, decided to make American Technical Ceramics Corp., a U.S.-based maker of electronic components, into a wholly-owned subsidiary in June 2007, with the goal of strengthening its advanced components business such as high frequency ceramic capacitors. In doing so, AVX will expand its product line-up and its sales networks for high-value-added products.

  • 4 -

(Yen in millions, except per share amounts and exchange rate) Three months ended June 30, 2006 2007 Increase Amount % of net sales Amount % of net sales (Decrease) (%)

Net sales 291,201 100.0 315,450 100.0 8.3 Profit from operations 29,902 10.3 31,616 10.0 5.7 Income from continuing operations before income taxes 36,065 12.4 40,484 12.8 12.3 Net income 20,072 6.9 24,984 7.9 24.5 Diluted earnings per share 106.61 — 131.93 — 23.8 Average US$ exchange rate 115 — 121 — — Average Euro exchange rate 144 — 163 — —

slide-5
SLIDE 5

(4) Consolidated Financial Results by Reporting Segment Components Business : Sales in the Components Business increased by 5.5% compared with the previous first quarter to ¥162,695 million, while operating profit decreased by 8.4% to ¥23,456 million. Consolidated results by reporting segment in the Components Business are as follows. 1) Fine Ceramic Parts Group Sales of semiconductor processing equipment increased during the first quarter. However, sales of automotive components for

  • verseas markets slumped. As a result, in this reporting segment sales increased, while operating profit decreased, compared with the

previous first quarter. 2) Semiconductor Parts Group Sales and operating profit in this reporting segment decreased compared with the previous first quarter. Despite an increase in sales of

  • rganic packages, there was an adjustment in demand for certain ceramic packages used in imaging devices.

3) Applied Ceramic Products Group While sales increased in this reporting segment compared with the previous first quarter due primarily to growth recorded in the solar energy business and the cutting tools business, profitability in the medical materials business deteriorated due to reduction in official

  • prices. As a result, operating profit decreased in this reporting segment.
  • 5 -
slide-6
SLIDE 6

4) Electronic Device Group Sales increased in this reporting segment compared with the previous first quarter. Apart from an increase in sales at AVX, sales of ceramic capacitors for flat-panel TVs and game consoles and of timing devices for mobile phone handsets grew. Operating profit slightly decreased due to an increase in depreciation. Equipment Business: Sales in the Equipment Business increased by 14.8% to ¥127,231 million, and operating profit increased by 55.6% to ¥9,037 million compared with the previous first quarter. Consolidated results by reporting segment in the Equipment Business are as follows. 1) Telecommunications Equipment Group Sales in this reporting segment increased compared with the previous first quarter due to robust sales of new mobile phone handsets in Japan. Operating profit improved compared with the previous first quarter due to the positive effect of sales growth in the domestic mobile phone handsets business and a reduction in loss at Kyocera Wireless Corp. 2) Information Equipment Group Sales and operating profit increased in this reporting segment due to sales contribution of color printers and multifunctional systems released late in the year ended March 31, 2007 (fiscal 2007). Others: Sales in this reporting segment slightly increased by 0.2% to remain roughly on par with the previous first quarter at ¥31,628 million. Operating profit increased by 82.4% to ¥1,297 million compared with the previous first quarter due mainly to sales growth at Kyocera Communication Systems Co., Ltd. and reduced loss in the optical-related business.

  • 6 -
slide-7
SLIDE 7

Consolidated Sales by Reporting Segment

  • 7 -

(Yen in millions) Three months ended June 30, 2006 2007 Increase (Decrease) % Amount % of net sales Amount % of net sales

Fine Ceramic Parts Group 18,617 6.4 20,545 6.5 10.4 Semiconductor Parts Group 36,013 12.4 35,277 11.2 (2.0) Applied Ceramic Products Group 31,258 10.7 33,420 10.6 6.9 Electronic Device Group 68,307 23.5 73,453 23.3 7.5 Total Components Business

154,195

53.0 162,695 51.6 5.5 Telecommunications Equipment Group 50,577 17.4 59,959 19.0 18.5 Information Equipment Group 60,266 20.7 67,272 21.3 11.6 Total Equipment Business

110,843

38.1 127,231 40.3 14.8 Others 31,556 10.8 31,628 10.0 0.2 Adjustments and eliminations (5,393) (1.9) (6,104) (1.9) — Net sales

291,201

100.0 315,450 100.0 8.3

slide-8
SLIDE 8

Consolidated Operating Profit by Reporting Segment Note 2. From April 1, 2007, the “Optical Equipment Group,” previously a separate reporting segment, has been reclassified into “Others.” Accordingly, sales and operating profit for the previous first quarter have been retroactively reclassified. Note 3. For the reasons set forth in Note 1 on page 4 and Note 2 above, net sales of “Others” in the previous first quarter increased by ¥1,118 million and “Adjustments and eliminations” decreased by ¥(219) million compared with those previously announced. Also,

  • perating profit of “Others” in the previous first quarter decreased by ¥1,329 million, and “Adjustments and eliminations” increased

by ¥(1) million compared with those previously announced. (5) Consolidated Sales by Geographic Area Note 4. For the reasons set forth in Note 1 on page 4, consolidated sales in Japan in the previous first quarter decreased by ¥1,495 million, compared with that of previously announced.

  • 8 -

(Yen in millions) Three months ended June 30, 2006 2007 Increase (Decrease) % Amount % of segment sales Amount % of segment sales

Fine Ceramic Parts Group 3,431 18.4 3,045 14.8 (11.3) Semiconductor Parts Group 5,511 15.3 4,023 11.4 (27.0) Applied Ceramic Products Group 6,389 20.4 6,136 18.4 (4.0) Electronic Device Group

10,269

15.0 10,252 14.0 (0.2) Total Components Business

25,600

16.6 23,456 14.4 (8.4) Telecommunications Equipment Group

(2,843)

— (369) — — Information Equipment Group 8,651 14.4 9,406 14.0 8.7 Total Equipment Business 5,808 5.2 9,037 7.1 55.6 Others 711 2.3 1,297 4.1 82.4 Operating profit

32,119

11.0 33,790 10.7 5.2 Corporate 4,342 — 4,917 — 13.2 Equity in (losses) earnings of affiliates and unconsolidated subsidiaries (343) — 1,772 — — Adjustments and eliminations (53) — 5 — — Income from continuing operations before income taxes

36,065

12.4 40,484 12.8 12.3

(Yen in millions) Three months ended June 30, 2006 2007 Increase (Decrease) (% ) Amount % of net sales Amount % of net sales

Japan

112,328

38.6 121,804 38.6 8.4 USA 61,703 21.2 62,692 19.9 1.6 Asia 51,128 17.5 57,480 18.2 12.4 Europe 46,468 16.0 55,383 17.6 19.2 Others 19,574 6.7 18,091 5.7 (7.6) Net sales

291,201

100.0 315,450 100.0 8.3

slide-9
SLIDE 9

1) Japan Sales increased compared with the previous first quarter due to large growth for mobile phone handsets and products in the Fine Ceramic Parts Group. 2) United States of America Sales slightly increased compared with the previous first quarter due to growth in mobile phone handsets and products in the Information Equipment Group, which was partly offset by decline in sales of the Electronic Device Group and the Semiconductor Parts Group. 3) Asia Sales substantially increased compared with the previous first quarter due to growth for products in the Electronic Device Group although sales in Personal Handyphone System decreased. 4) Europe Sales increased largely compared with the previous first quarter due to growth for the Information Equipment Group coupled with growth in solar energy business. 5) Others Sales decreased compared with the previous first quarter due to decline in sales of the Telecommunication Equipment Group in Oceania.

  • 9 -
slide-10
SLIDE 10
  • 2. Cash flows

Cash and cash equivalents at June 30, 2007 increased by ¥4,354 million to ¥286,562 million compared with those at March 31, 2007. 1) Cash Flows from Operating Activities Net cash provided by operating activities in the first quarter increased by ¥7,406 million to ¥35,010 million from the previous first quarter of ¥27,604 million. Although payments of income taxes increased, net income increased by ¥4,912 million and cash and cash equivalent in connection with receivables and inventories significantly increased compared with the previous first quarter. 2) Cash Flows from Investing Activities Net cash used in investing activities in the first quarter decreased by ¥26,023 million to ¥35,060 million from the previous first quarter of ¥61,083 million. This was due mainly to a decrease in deposit of negotiable certificate of deposits and time deposits compared with the previous first quarter. 3) Cash Flows from Financing Activities Cash flows from financing activities changed from ¥240 million of net cash provided by during the previous first quarter to ¥3,549 million of net cash used in during this first quarter. This was due mainly to decreases in proceeds of issuance of short and long term debt and increases in dividends paid.

  • 10 -

(Yen in millions) Three months ended June 30, 2006 2007

Cash flows from operating activities 27,604 35,010 Cash flows from investing activities (61,083) (35,060) Cash flows from financing activities 240 (3,549) Effect of exchange rate changes on cash and cash equivalents (946) 7,953 Net (decrease) increase in cash and cash equivalents (34,185) 4,354 Cash and cash equivalents at beginning of period 300,809 282,208 Cash and cash equivalents at end of period 266,624 286,562

slide-11
SLIDE 11
  • 3. Consolidated Financial Forecast for the Year Ending March 31, 2008

Performance in the first quarter progressed steadily toward the attainment of full-year forecasts. Production activities for personal computers and mobile phone handsets are expected to be further brisk from the second quarter of the year ending March 31, 2008 (fiscal 2008) onward. As a result, Kyocera forecasts growth in demand of components used in these products. Profits are therefore expected to increase in the Components Business. Kyocera also forecasts growth in the solar energy business in light of plans to increase production volume of solar cells and modules in the second half of fiscal 2008. In addition, an ongoing program of new product introductions is expected to boost sales and profits in the Equipment Business. Consolidated forecasts for fiscal 2008 are as follows and there is no revision of our initial forecasts. Consolidated forecasts for fiscal 2008 (Released on April 26, 2007) Note 5. The average U.S. dollar and Euro exchange rates set forth above are the forecast average from July 1, 2007 to March 31, 2008. Note 6. Forecast of diluted earnings per share for fiscal 2008 set forth above is computed based on the diluted average number of shares outstanding during the first quarter.

  • 11 -

(Yen in millions, except per share amounts and exchange rates) Fiscal 2008 Forecasts Increase (Decrease) from Fiscal 2007 (% ) Amount % of net sales

Net sales 1,330,000 100.0 3.6 Profit from operations 151,000 11.4 11.8 Income before income taxes 166,000 12.5 6.0 Net income 103,000 7.7 (3.3) Diluted earnings per share 543.89 — (3.7) Average US$ exchange rate 110 — — Average Euro exchange rate 150 — —

slide-12
SLIDE 12

Note 7. Forward-Looking Statements Certain of the statements made in this document are forward-looking statements (within the meaning of Section 21E of the U.S. Securities and Exchange Act of 1934), which are based on our current assumptions and beliefs in light of the information currently available to us. These forward-looking statements involve known and unknown risks, uncertainties and other factors. Such risks, uncertainties and other factors include, but are not limited to: general economic conditions in our markets, which are primarily Japan, North America, Europe, and Asia, particularly including China; unexpected changes in economic, political and legal conditions in China; our ability to develop, launch and produce innovative products, including meeting quality and delivery standards, and our ability to otherwise meet the advancing technical requirements of our customers, particularly in the highly competitive markets for ceramics, semiconductor parts and electronic components manufacturing delays or defects resulting from outsourcing or internal manufacturing processes which may adversely affect our production yields and operating results; factors that may affect our exports, including a strong yen, political and economic instability, difficulties in collection of accounts receivable, decrease in cost competitiveness of our products, increases in shipping and handling costs, difficulty in staffing and managing international

  • perations, and inadequate protection of our intellectual property; changes in exchange rates, particularly between the yen and the

U.S. dollar and euro, respectively, in which we make significant sales; inability to secure skilled employees, particularly engineering and technical personnel; insufficient protection of our trade secrets and patents; holding licenses to continue to manufacture and sell certain of its products, the expense of which may adversely affects its results of operations; future initiatives and in-process research and development may not produce the desired results; events that may impact negatively on our markets or supply chain, including terrorist acts and outbreaks of diseases; the occurrence of natural disasters, such as earthquakes, in locations where our manufacturing and other key business facilities are located; and fluctuations in the value of, and impairment losses on, securities and other assets held by us, and changes in accounting principles. Such risks, uncertainties and other factors may cause our actual results, performance, achievements or financial position to be materially different from any future results, performance, achievements or financial position expressed or implied by these forward-looking statements. We undertake no obligation to publicly update any forward-looking statements included in this document.

  • 12 -
slide-13
SLIDE 13

CONSOLIDATED BALANCE SHEETS

  • 13 -

Yen in millions (Unaudited) June 30, 2006 (Unaudited) June 30, 2007 March 31, 2007 Amount % Amount % Amount %

Current assets : Cash and cash equivalents

¥ 266,624 ¥ 286,562 ¥ 282,208

Short-term investments 129,941 215,888 213,495 Trade notes receivables 24,981 23,388 25,033 Trade accounts receivables 199,679 227,590 236,380 Less allowances for doubtful accounts and sales returns (7,055) (6,333) (5,960) Inventories 203,030 211,773 209,188 Deferred income taxes 40,911 46,239 45,390 Other current assets 75,596 81,202 40,757 Total current assets 933,707 47.3 1,086,309 50.5 1,046,491 49.1 Non-current assets : Investments and advances : Investments in and advances to affiliates and unconsolidated subsidiaries 7,017 11,941 10,093 Securities and other investments 582,216 660,474 690,568 Total investments and advances 589,233 29.9 672,415 31.2 700,661 32.9 Property, plant and equipment, at cost : Land 58,375 57,604 56,806 Buildings 251,710 266,971 261,998 Machinery and equipment 705,111 748,955 729,636 Construction in progress 8,232 10,071 7,362 Less accumulated depreciation (737,524) (800,460)

(774,896)

Total property, plant and equipment, at cost 285,904 14.5 283,141 13.2 280,906 13.2 Goodwill 31,166 1.6 34,204 1.6 32,894 1.5 Intangible assets 30,041 1.5 23,876 1.1 24,657 1.2 Other assets 103,765 5.2 51,625 2.4 44,855 2.1 Total non-current assets

1,040,109

52.7 1,065,261 49.5 1,083,973 50.9 Total assets

¥1,973,816 100.0 ¥2,151,570 100.0 ¥2,130,464 100.0

slide-14
SLIDE 14

Note : Accumulated other comprehensive income is as follows.

  • 14 -

Yen in millions (Unaudited) (Unaudited) June 30, 2006 June 30, 2007 March 31, 2007 Amount % Amount % Amount %

Current liabilities : Short-term borrowings

¥

99,062

¥

21,998

¥

15,250 Current portion of long-term debt 17,728 5,501 5,853 Trade notes and accounts payable 103,863 95,400 100,295 Other notes and accounts payable 44,631 47,708 49,134 Accrued payroll and bonus 45,889 49,493 41,680 Accrued income taxes 17,756 15,732 36,475 Other accrued liabilities 31,778 32,756 33,391 Other current liabilities 19,701 28,341 24,110 Total current liabilities 380,408 19.3 296,929 13.8 306,188 14.4 Non-current liabilities : Long-term debt 31,848 6,984 7,283 Accrued pension and severance liabilities 24,844 16,922 16,297 Deferred income taxes 140,975 201,593 206,858 Other non-current liabilities 10,735 14,417 12,355 Total non-current liabilities 208,402 10.5 239,916 11.2 242,793 11.4 Total liabilities 588,810 29.8 536,845 25.0 548,981 25.8 Minority interests in subsidiaries 65,496 3.3 71,471 3.3 66,923 3.1 Stockholders’ equity : Common stock 115,703 115,703 115,703 Additional paid-in capital 161,960 162,528 162,363 Retained earnings 978,261

1,072,926 1,055,293

Accumulated other comprehensive income 91,269 211,213 203,056 Treasury stock, at cost (27,683) (19,116) (21,855) Total stockholders’ equity

1,319,510

66.9 1,543,254 71.7 1,514,560 71.1 Total liabilities, minority interests and stockholders’ equity

¥1,973,816 100.0 ¥2,151,570 100.0 ¥2,130,464 100.0 Yen in millions June 30, 2006 June 30, 2007 March 31, 2007

Net unrealized gains on securities ¥ 104,270 ¥ 177,110 ¥ 184,670 Net unrealized (losses) gains on derivative financial instruments ¥ (134) ¥ (49) ¥ 63 Minimum pension liability adjustments ¥ (2,057) — — Pension adjustments — ¥ 14,831 ¥ 15,419 Foreign currency translation adjustments ¥ (10,810) ¥ 19,321 ¥ 2,904

slide-15
SLIDE 15

CONSOLIDATED STATEMENTS OF INCOME (Unaudited)

  • 15 -

Yen in millions and shares in thousands, except per share amounts Three months ended June 30, Increase 2006 2007 (Decrease) Amount % Amount % Amount %

Net sales

¥ 291,201 100.0 ¥ 315,450 100.0 ¥ 24,249

8.3 Cost of sales 200,345 68.8 219,826 69.7 19,481 9.7 Gross profit 90,856 31.2 95,624 30.3 4,768 5.2 Selling, general and administrative expenses 60,954 20.9 64,008 20.3 3,054 5.0 Profit from operations 29,902 10.3 31,616 10.0 1,714 5.7 Other income (expenses) : Interest and dividend income 4,586 1.6 6,309 2.0 1,723 37.6 Interest expense (219) (0.1) (410) (0.1) (191) — Foreign currency transaction (losses) gains, net (55) (0.0) 1,009 0.3 1,064 — Equity in (losses) earnings of affiliates and unconsolidated subsidiaries (343) (0.1) 1,772 0.6 2,115 — Gains (losses) on sales of securities, net 1,810 0.6 (14) (0.0) (1,824) — Other, net 384 0.1 202 0.0 (182) (47.4) Total other income 6,163 2.1 8,868 2.8 2,705 43.9 Income from continuing operations before income taxes and minority interests 36,065 12.4 40,484 12.8 4,419 12.3 Income taxes 15,080 5.2 13,972 4.4 (1,108) (7.3) Income from continuing operations before minority interests 20,985 7.2 26,512 8.4 5,527 26.3 Minority interests (1,394) (0.5) (1,528) (0.5) (134) — Income from continuing operations 19,591 6.7 24,984 7.9 5,393 27.5 Income from discontinued operations 481 0.2 — — (481) — Net income

¥ 20,072

6.9 ¥ 24,984 7.9 ¥ 4,912 24.5 Earnings per share : Income from continuing operations : Basic

¥ 104.26 ¥ 132.30

Diluted

¥ 104.06 ¥ 131.93

Income from discontinued operations : Basic

¥

2.56 — Diluted

¥

2.55 — Net income : Basic

¥ 106.82 ¥ 132.30

Diluted

¥ 106.61 ¥ 131.93

Weighted average number of shares of common stock outstanding : Basic 187,901 188,846 Diluted

188,283 189,378

slide-16
SLIDE 16

Notes :

  • 16 -

1. Kyocera applies the Statement of Financial Accounting Standards Board (SFAS) No.130, “Financial Reporting of Comprehensive Income.” Based on this standard, comprehensive income for the three months ended June 30, 2006 and 2007 were an increase of ¥38,394 million and an increase of ¥33,141 million, respectively. 2. Earnings per share amounts were computed based on SFAS No.128, “Earnings per Share.” Under SFAS No.128, basic earnings per share was computed based on the average number of shares of common stock outstanding during each period and diluted earnings per share assumed the dilution that could occur if securities or other contracts to issue common stock were converted into common stock, exercised or resulted in the issuance of common stock. 3. In accordance with SFAS No.144, “Accounting for the Impairment or Disposal of Long-Lived Assets,” the consolidated financial statement for the three months ended June 30, 2006 has been retrospectively reclassified as for the discontinued

  • perations.
slide-17
SLIDE 17

CONSOLIDATED STATEMENTS OF STOCKHOLDERS’ EQUITY

  • 17 -

Yen in millions and shares in thousands (Number of shares of common stock) Common stock Additional paid-in capital Retained earnings Accumulated

  • ther

comprehensive income Treasury stock Comprehensive income

Balance, March 31, 2006 (187,755)

¥

115,703 ¥161,994 ¥ 967,576 ¥ 72,947 ¥(29,143) Net income for the year 106,504

¥

106,504 Other comprehensive income 112,551 112,551 Total comprehensive income for the year

¥

219,055 Adjustment for initially applying SAFS No. 158, net of taxes 17,558 Cash dividends (18,787) Purchase of treasury stock (24) (251) Reissuance of treasury stock (918) 127 7,539 Stock option plan of subsidiaries 242 Balance, March 31, 2007 (188,649) 115,703 162,363 1,055,293 203,056 (21,855) (Unaudited) Cumulative effect of applying FIN 48 to opening balance (Note) 3,968 Net income for the period 24,984

¥

24,984 Other comprehensive income 8,157 8,157 Total comprehensive income for the period

¥

33,141 Cash dividends (11,319) Purchase of treasury stock (5) (60) Reissuance of treasury stock (341) 102 2,799 Stock option plan of subsidiaries 63 Balance, June 30, 2007 (188,985)

¥

115,703 ¥162,528 ¥1,072,926 ¥ 211,213 ¥(19,116)

slide-18
SLIDE 18

Note : In June 2006, the Financial Accounting Standard Board (FASB) issued Interpretation No. 48, “Accounting for Uncertainty in Income Taxes-an interpretation of FASB Statement No.109” (FIN 48) which clarifies the accounting for uncertainty in income taxes recognized in the financial statements in accordance with SFAS No. 109, “Accounting for Income Taxes.” FIN 48 also provides guidance on derecognition, classification, interest and penalties, disclosure and transitional measures. Cumulative effect of applying FIN 48, which was effective April 1, 2007, increased the opening balance of retained earnings by ¥3,968 million.

  • 18 -

Yen in millions and shares in thousands (Number of shares of common stock) Common stock Additional paid-in capital Retained earnings Accumulated

  • ther

comprehensive income Treasury stock Comprehensive income

Balance, March 31, 2006 (187,755)

¥

115,703 ¥161,994 ¥967,576 ¥ 72,947 ¥(29,143) (Unaudited) Net income for the period 20,072

¥

20,072 Other comprehensive income 18,322 18,322 Total comprehensive income for the period

¥

38,394 Cash dividends (9,387) Purchase of treasury stock (4) (43) Reissuance of treasury stock (183) (34) 1,503 Balance, June 30, 2006 (187,934)

¥

115,703 ¥161,960 ¥978,261 ¥ 91,269 ¥(27,683)

slide-19
SLIDE 19

CONSOLIDATED STATEMENTS OF CASH FLOWS (Unaudited)

  • 19 -

Yen in millions Three months ended June 30, 2006 2007

Cash flows from operating activities : Net income

¥

20,072 ¥ 24,984 Adjustments to reconcile net income to net cash provided by operating activities : Depreciation and amortization 16,699 19,242 Write-down of inventories 1,640 2,205 (Gains) losses on sales of securities, net (1,810) 14 Minority interests 1,394 1,528 Decrease in receivables 4,002 17,132 (Increase) decrease in inventories (15,355) 1,953 Increase (decrease) in notes and accounts payable 3,109 (16,223) Decrease in accrued income taxes (10,138) (20,013) Increase in other current liabilities 9,583 11,605 Other, net (1,592) (7,417) Net cash provided by operating activities 27,604 35,010 Cash flows from investing activities : Payments for purchases of securities (19,516) (11,915) Sales and maturities of securities 16,009 21,316 Payments for purchases of property, plant and equipment, and intangible assets (18,219) (17,839) Proceeds from sales of property, plant and equipment, and intangible assets 309 300 Deposit of negotiable certificate of deposits and time deposits (85,924) (49,664) Withdrawal of negotiable certificate of deposits and time deposits 46,249 22,533 Other, net 9 209 Net cash used in investing activities (61,083) (35,060) Cash flows from financing activities : Increase in short-term debt 8,324 5,847 Proceeds from issuance of long-term debt 1,451 — Payments of long-term debt (1,326) (914) Dividends paid (9,508) (11,174) Purchase of treasury stock (43) (60) Reissuance of treasury stock 1,469 2,901 Other, net (127) (149) Net cash provided by (used in) financing activities 240 (3,549) Effect of exchange rate changes on cash and cash equivalents (946) 7,953 Net (decrease) increase in cash and cash equivalents (34,185) 4,354 Cash and cash equivalents at beginning of period 300,809 282,208 Cash and cash equivalents at end of period

¥ 266,624

¥ 286,562

slide-20
SLIDE 20

SEGMENT INFORMATION (Unaudited)

  • 1. Reporting segments :
  • 20 -

Yen in millions Three months ended June 30, 2006 2007 Increase (Decrease) Amount Amount Amount %

Net sales : Fine Ceramic Parts Group

¥

18,617 ¥ 20,545 ¥ 1,928 10.4 Semiconductor Parts Group 36,013 35,277 (736) (2.0) Applied Ceramic Products Group 31,258 33,420 2,162 6.9 Electronic Device Group 68,307 73,453 5,146 7.5 Telecommunications Equipment Group 50,577 59,959 9,382 18.5 Information Equipment Group 60,266 67,272 7,006 11.6 Others 31,556 31,628 72 0.2 Adjustments and eliminations (5,393) (6,104) (711) —

¥ 291,201 ¥ 315,450 ¥ 24,249

8.3 Operating profit : Fine Ceramic Parts Group

¥

3,431 ¥ 3,045 ¥ (386) (11.3) Semiconductor Parts Group 5,511 4,023 (1,488) (27.0) Applied Ceramic Products Group 6,389 6,136 (253) (4.0) Electronic Device Group 10,269 10,252 (17) (0.2) Telecommunications Equipment Group (2,843) (369) 2,474 — Information Equipment Group 8,651 9,406 755 8.7 Others 711 1,297 586 82.4 32,119 33,790 1,671 5.2 Corporate 4,342 4,917 575 13.2 Equity in (losses) earnings of affiliates and unconsolidated subsidiaries (343) 1,772 2,115 — Adjustments and eliminations (53) 5 58 — Income from continuing operations before income taxes and minority interests

¥

36,065 ¥ 40,484 ¥ 4,419 12.3 Depreciation and amortization : Fine Ceramic Parts Group

¥

905 ¥ 1,459 ¥ 554 61.2 Semiconductor Parts Group 2,770 3,129 359 13.0 Applied Ceramic Products Group 1,811 2,006 195 10.8 Electronic Device Group 4,430 5,274 844 19.1 Telecommunications Equipment Group 1,547 2,241 694 44.9 Information Equipment Group 3,252 2,788 (464) (14.3) Others 1,311 1,561 250 19.1 Corporate 637 784 147 23.1 Total

¥

16,663 ¥ 19,242 ¥ 2,579 15.5 Capital expenditures : Fine Ceramic Parts Group

¥

990 ¥ 1,174 ¥ 184 18.6 Semiconductor Parts Group 3,310 2,027 (1,283) (38.8) Applied Ceramic Products Group 845 1,717 872 103.2 Electronic Device Group 5,404 5,113 (291) (5.4) Telecommunications Equipment Group 943 542 (401) (42.5) Information Equipment Group 3,915 1,924 (1,991) (50.9) Others 730 792 62 8.5 Corporate 575 1,755 1,180 205.2 Total

¥

16,712 ¥ 15,044 ¥ (1,668) (10.0)

slide-21
SLIDE 21
  • 2. Geographic segments (Sales and Operating profit by geographic area) :
  • 21 -

Yen in millions Three months ended June 30, 2006 2007 Increase (Decrease) Amount Amount Amount %

Net sales : Japan

¥ 119,482

¥ 128,689 ¥ 9,207 7.7 Intra-group sales and transfer between geographic areas 91,654 93,725 2,071 2.3 211,136 222,414 11,278 5.3 United States of America 71,539 73,213 1,674 2.3 Intra-group sales and transfer between geographic areas 8,941 8,739 (202) (2.3) 80,480 81,952 1,472 1.8 Asia 45,263 49,761 4,498 9.9 Intra-group sales and transfer between geographic areas 36,880 42,908 6,028 16.3 82,143 92,669 10,526 12.8 Europe 48,824 57,739 8,915 18.3 Intra-group sales and transfer between geographic areas 10,064 10,546 482 4.8 58,888 68,285 9,397 16.0 Others 6,093 6,048 (45) (0.7) Intra-group sales and transfer between geographic areas 2,595 3,587 992 38.2 8,688 9,635 947 10.9 Adjustments and eliminations (150,134) (159,505) (9,371) —

¥ 291,201 ¥ 315,450 ¥ 24,249

8.3 Operating profit : Japan

¥

23,162 ¥ 23,897 ¥ 735 3.2 United States of America 2,449 2,203 (246) (10.0) Asia 5,212 5,592 380 7.3 Europe 1,755 2,758 1,003 57.2 Others 1,578 774 (804) (51.0) 34,156 35,224 1,068 3.1 Adjustments and eliminations (2,090) (1,429) 661 — 32,066 33,795 1,729 5.4 Corporate 4,342 4,917 575 13.2 Equity in (losses) earnings of affiliates and unconsolidated subsidiaries (343) 1,772 2,115 — Income from continuing operations before income taxes and minority interest

¥

36,065 ¥ 40,484 ¥ 4,419 12.3

slide-22
SLIDE 22
  • 3. Geographic segments (Sales by region) :
  • 22 -

Yen in millions Three months ended June 30, Increase (Decrease) 2006 2007 Amount % Amount % Amount %

Japan

¥112,328 38.6 ¥121,804 38.6

¥9,476 8.4 United States of America 61,703 21.2 62,692

19.9

989 1.6 Asia 51,128 17.5 57,480

18.2

6,352 12.4 Europe 46,468

16.0

55,383

17.6

8,915 19.2 Others 19,574 6.7 18,091 5.7 (1,483) (7.6) Net sales

¥291,201 100.0 ¥315,450 100.0 ¥24,249

8.3 Sales outside Japan

¥178,873 ¥193,646

14,773 8.3 Sales outside Japan to net sales 61.4% 61.4%

slide-23
SLIDE 23

Appendix Consolidated Orders and Production by Reporting Segment Consolidated Orders by Reporting Segment Note 1. From April 1, 2007, the “Optical Equipment Group,” previously a separate reporting segment, has been reclassified into “Others.” Accordingly, previously reported orders for the previous first quarter have been retroactively reclassified. Note 2. For the reasons set forth in Note 1 on page 4 and Note 1 above, orders of “Others” in the previous first quarter increased by ¥778 million, “Adjustments and eliminations” decreased by ¥(202) million and total of “Orders” decreased by ¥2,112 million compared with those previously announced.

  • 23 -

(Yen in millions) Three month ended June 30, Increase (Decrease) (%) 2006 2007 Amount % of

  • rders

Amount % of

  • rders

Fine Ceramic Parts Group 19,629 6.3 21,194 6.8 8.0 Semiconductor Parts Group 37,542 12.1 36,062 11.6 (3.9) Applied Ceramic Products Group 32,985 10.7 34,162 10.9 3.6 Electronic Device Group 73,354 23.7 75,645 24.2 3.1 Total Components Business

163,510

52.8 167,063 53.5 2.2 Telecommunications Equipment Group 58,714 18.9 50,872 16.3 (13.4) Information Equipment Group 60,072 19.4 67,601 21.7 12.5 Total Equipment Business

118,786

38.3 118,473 38.0 (0.3) Others 32,960 10.6 32,256 10.3 (2.1) Adjustments and eliminations (5,391) (1.7) (5,799) (1.8) — Orders

309,865

100.0 311,993 100.0 0.7

slide-24
SLIDE 24

Consolidated Production by Reporting Segment Note 3. From April 1, 2007, the “Optical Equipment Group,” previously a separate reporting segment, has been reclassified into “Others.” Accordingly, previously reported production for the previous first quarter have been retroactively reclassified.

  • 24 -

(Yen in millions) Three month ended June 30, Increase (Decrease) (%) 2006 2007 Amount % of production Amount % of production

Fine Ceramic Parts Group 18,659 6.2 20,634 6.5 10.6 Semiconductor Parts Group 37,473 12.6 35,642 11.3 (4.9) Applied Ceramic Products Group 31,501 10.6 35,208 11.2 11.8 Electronic Device Group 69,283 23.3 75,306 23.9 8.7 Total Components Business

156,916

52.7 166,790 52.9 6.3 Telecommunications Equipment Group 52,358 17.6 55,697 17.7 6.4 Information Equipment Group 65,830 22.1 69,103 21.9 5.0 Total Equipment Business

118,188

39.7 124,800 39.6 5.6 Others 22,586 7.6 23,569 7.5 4.4 Production

297,690

100.0 315,159 100.0 5.9

slide-25
SLIDE 25

Consolidated Financial Highlights (Unaudited) Results for the Three Months Ended June 30, 2007 Note : Kyocera sold its shares in Kyocera Leasing Co., Ltd., a subsidiary engaged in financing services in the year ended March 31, 2007, and as a result, business results of Kyocera Leasing Co., Ltd. for the three months ended June 30, 2006 have been recorded as income from discontinued operations in conformity with accounting principles generally accepted in the U.S. As a result, reclassified consolidated net sales for the three months ended June 30, 2006 decreased by ¥1,495 million compared with the result previously announced, reclassified profit from operations decreased by ¥740 million, income from continuing operations before income taxes decreased by ¥862 million, capital expenditures decreased by ¥18 million, depreciation decreased by ¥17 million, respectively. The rate of sales of products manufactured outside Japan to net sales was 0.2 points higher than the result previously announced.

  • 25 -

July 30, 2007 KYOCERA CORPORATION

(Yen in millions, except per share amounts and exchange rates) Three months ended June 30, Increase (Decrease) % 2006 2007

Net sales 291,201 315,450 8.3 Profit from operations 29,902 31,616 5.7 Income from continuing operations before income taxes 36,065 40,484 12.3 Net income 20,072 24,984 24.5 Average exchange rates : US$ 115 121 — Euro 144 163 — Earnings per share : Net income : Basic 106.82 132.30 23.9 Diluted 106.61 131.93 23.8 Capital expenditures 16,712 15,044 (10.0) Depreciation 14,427 16,281 12.9 R&D expenses 15,632 15,315 (2.0) Total assets 1,973,816 2,151,570 9.0 Stockholders’ equity 1,319,510 1,543,254 17.0 Sales of products manufactured outside Japan to net sales (%) 34.1 33.7 —