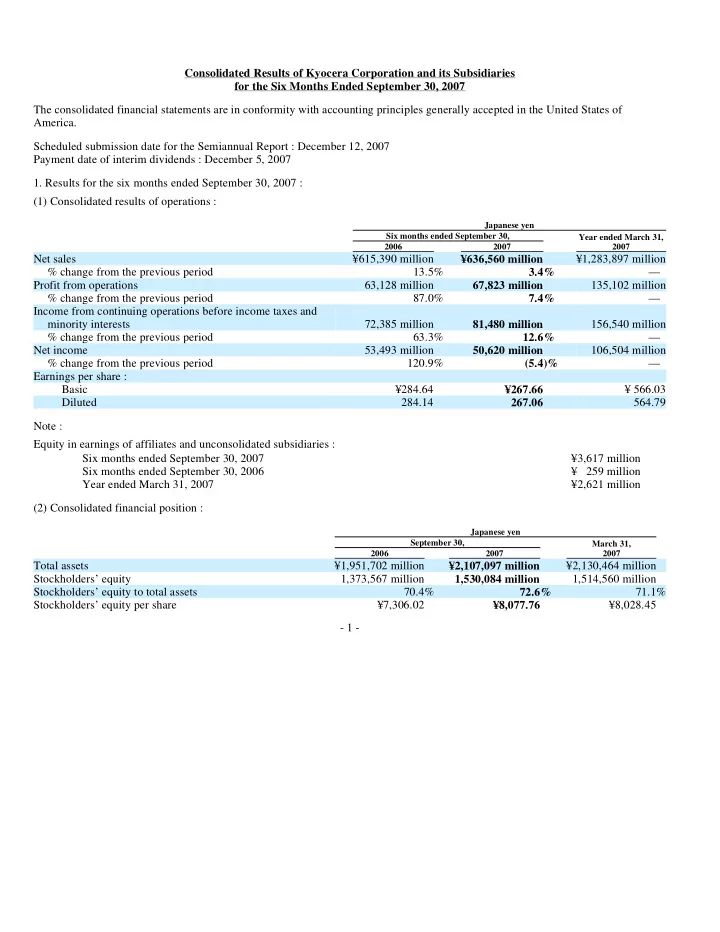

Consolidated Results of Kyocera Corporation and its Subsidiaries for the Six Months Ended September 30, 2007 The consolidated financial statements are in conformity with accounting principles generally accepted in the United States of America. Scheduled submission date for the Semiannual Report : December 12, 2007 Payment date of interim dividends : December 5, 2007
- 1. Results for the six months ended September 30, 2007 :
(1) Consolidated results of operations : Note : Equity in earnings of affiliates and unconsolidated subsidiaries : (2) Consolidated financial position :
- 1 -
Japanese yen Six months ended September 30, Year ended March 31, 2006 2007 2007
Net sales ¥615,390 million ¥636,560 million ¥1,283,897 million % change from the previous period 13.5% 3.4% — Profit from operations 63,128 million 67,823 million 135,102 million % change from the previous period 87.0% 7.4% — Income from continuing operations before income taxes and minority interests 72,385 million 81,480 million 156,540 million % change from the previous period 63.3% 12.6% — Net income 53,493 million 50,620 million 106,504 million % change from the previous period 120.9% (5.4)% — Earnings per share : Basic ¥284.64 ¥267.66 ¥ 566.03 Diluted 284.14 267.06 564.79 Six months ended September 30, 2007 ¥3,617 million Six months ended September 30, 2006 ¥ 259 million Year ended March 31, 2007 ¥2,621 million
Japanese yen September 30, March 31, 2006 2007 2007
Total assets ¥1,951,702 million ¥2,107,097 million ¥2,130,464 million Stockholders’ equity 1,373,567 million 1,530,084 million 1,514,560 million Stockholders’ equity to total assets 70.4% 72.6% 71.1% Stockholders’ equity per share ¥7,306.02 ¥8,077.76 ¥8,028.45