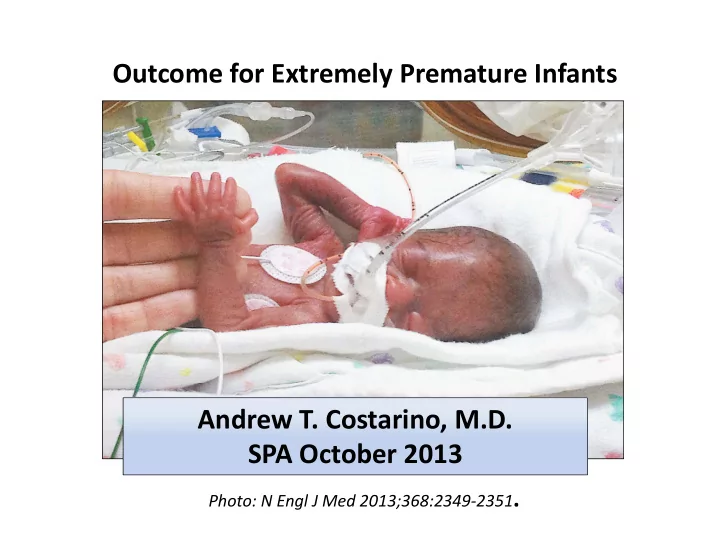
SLIDE 1 A 400‐Gram Female Infant Delivered at 24 and 4/7 Weeks.
Outcome for Extremely Premature Infants Andrew T. Costarino, M.D. SPA October 2013
Photo: N Engl J Med 2013;368:2349‐2351.
SPA October 2013
SLIDE 2 P t Bi th i t
– 37 completed weeks of gestation f th 259 d i th fi t d f – or fewer than 259 days since the first day of a woman’s last menstrual period.
- Sub‐divided on gestational age:
- Sub‐divided on gestational age:
- Late preterm
(34 to <37 weeks)
- Moderate preterm (32 to <34 weeks)
Moderate preterm (32 to <34 weeks)
(28 to <32 weeks)
- Extremely preterm (<28 weeks)
Extremely preterm (<28 weeks) W ld H lth O i ti 1977 World Health Organization: 1977
SLIDE 3 Preterm Birth USA, 2011
Total Births 3 953 590 Total Births ‐ 3,953,590 Total Preterm Births ‐ 463,756 Preterm Birth Rate – 11.73% Associated Infant Deaths – 10,991
440 000 495,000 275 000 330,000 385,000 440,000
34 ‐ 36 wks 8.28% (327,357) 32 ‐ 33 wks 1.52% (60,095)
165,000 220,000 275,000
28 ‐ 31 wks 1.2% (47,443)
55,000 110,000
<28 wks .73% (28,861)
Preterm
CDC, National Center for Health Statistics Final Data 2011
SLIDE 4 Preterm Birth USA
Preterm Birth Rate 2012: 11 5% Preterm Birth Rate 2012: 11.5%
SLIDE 5
Twin and triplet birth rates: USA, 1980–2010 Hamilton BE et al. Pediatrics 2013;131:548‐558
SLIDE 6 VLBW Outcomes of the NICHD Neonatal Network
90 100
Survival by GA
50 60 70 80 90
val (%)
20 30 40 50
Surviv
10
Gestational Age
Hack M et al. Pediatrics 1991;87: 587‐597
SLIDE 7
ELBW Infants Outcome
Innovation Time CPAP, MV techniques 1980’s Exogenous Surfactant Early 1990’s Antenatal Steroids Mid/Late 1990’s Avoiding Postnatal Steroids Early 2000’s Targeted Oxygen Therapy Mid 2000’s Systematic Care/Experience Continuous
SLIDE 8 Outcome Studies ELBW Infants
Country Country Year Year Sponsor Sponsor
1 USA 1987 NICHD 2 USA 1992 NICHD 3 Australia 1992 Victoria Collaborative Study Group 4 Belgium 1992 EPIBEL Study Group 5 UK/Ireland 1995 EPIcure Study Collaborative 6 France 1997 EPIPAGE Study Group 7 USA 2003 Vermont Oxford 8 USA 2004 NICHD 9 Australia 2005 Victoria Collaborative Study Group 10 Belgium 2005 EPIBEL Study Group 10 Belgium 2005 EPIBEL Study Group 11 Japan 2005 Japanese Neonatal Network
SLIDE 9 ELBW Infants Survival
80 100 26 weeks 60
cent
25 weeks 24 weeks 40
Perc
23 weeks 22 weeks 20
1 2 3 4 5 6 7
SLIDE 10 ELBW Infants Survival
80 100 26 weeks 60
cent
25 weeks 24 weeks 40
Perc
23 weeks 22 weeks 20
1 2 3 4 5 6 7
SLIDE 11
ELBW Morbidity ELBW Morbidity Risk Risk 95% CI 95% CI
Acute/NICU Acute/NICU Any ROP Severe ROP Severe ROP IVH (Grade III‐IV) Surgical NEC g Chronic Problems BPD (O2 at 36 weeks) BPD (clinical) Blindness Hearing loss Cerebral Palsy Cognitive Delay
SLIDE 12
Cross KW. Lancet 1973;ii:954‐956
SLIDE 13 ELBW Oxygen Trials
– NEJM 2010;362:1959 NEJM 2010;362:1959. – NEJM 2012;367:2995.
- Canada/Europe: “COT” N=1201
- Canada/Europe: COT N=1201
– JAMA. 2013;309:2111.
- UK/Australia/NZ: “BOOST” N=2448
- UK/Australia/NZ: “BOOST” N=2448
– NEJM 2013;368: 2094‐2104
SLIDE 14
ELBW Morbidity ELBW Morbidity Risk Risk 95% CI 95% CI
Acute/NICU Acute/NICU Any ROP 63.7 60.6 – 66.6 Severe ROP 12.3 11.3 – 13.3 Severe ROP IVH (Grade III‐IV) 14.1 13.1 – 15.2 Surgical NEC 10.1 9.3 – 11.0 g Chronic Problems BPD (O2 at 36 weeks) 42.2 40.4 – 43.9 BPD (clinical) 38.7 36.9 – 40.5 Blindness 0.8 0.36 – 1.62 Hearing loss 3.1 2.1 – 4.4 Cerebral Palsy 6.1 4.7 – 7.7 Cognitive Delay 7.4 5.2 – 9.4
SLIDE 15 ELBW Morbidity: Neurodevelopmental
- Domains of Neurodevelopmental disabilities
Domains of Neurodevelopmental disabilities. –Motor (cerebral palsy) G
–Cognition –Speech and language Speech and language, –Personal‐social A i i i f d il li i –Activities of daily living.
SLIDE 16 ELBW Morbidity: Cerebral Palsy
Cerebral Palsy
A i di bili d d h
- A non‐progressive motor disability due to damage to the
motor control centers of the developing brain. D d i t ti t bi th ft bi th
- Damage can occur during gestation, at birth or after birth
up to about 3 years of age.
- Affects about 2 5/1 000 children in the US
- Affects about 2.5/1,000 children in the US.
- Prematurely born infants are at increased risk for CP.
- Close to half of children with CP were born prematurely.
- Often used as a marker for over‐all neurologic outcomes
associated with prematurity.
SLIDE 17 Risk of Cerebral Palsy Risk of Cerebral Palsy
45
Pooled Risk Estimate 10.4 95% CI: 7.3 – 13.5
30 35 40
urvivors
15 20 25
cent of su
5 10
Perc
SLIDE 18
ELBW Morbidity
Reid SM et al. Dev Med Child Neurol 2011; 53:907‐912.
SLIDE 19
ELBW Morbidity ELBW Morbidity Risk Risk 95% CI 95% CI
Acute/NICU Acute/NICU Any ROP 63.7 60.6 – 66.6 Severe ROP 12.3 11.3 – 13.3 Severe ROP IVH (Grade III‐IV) 14.1 13.1 – 15.2 Surgical NEC 10.1 9.3 – 11.0 g Chronic Problems BPD (O2 at 36 weeks) 42.2 40.4 – 43.9 BPD (clinical) 38.7 36.9 – 40.5 Blindness 0.8 0.36 – 1.62 Hearing loss 3.1 2.1 – 4.4 Cerebral Palsy 6.1 4.7 – 7.7 Cognitive Delay 7.4 5.2 – 9.4
SLIDE 20
Logistic regression: O d/ CP Outcome: mod/severe CP Risk factors: PVL Grade 3‐4 IVH BPD Postnatal Steroids Postnatal Steroids Male Gender
Vohr BR et al. Pediatrics 2005;116:635‐643
SLIDE 21 ELBW Morbidity: Cognitive Delay ELBW Morbidity: Cognitive Delay
- Bayley Scales of Infant Development, (designed for children aged 0
to 3 years) to 3 years).
- The first developed in the 1960’s
- Behavioral/play examination raw score converted to composite
- Behavioral/play examination ‐ raw score converted to composite
scale then referenced to normative values.
- The scores have a normal distribution with a mean of 100 and
The scores have a normal distribution with a mean of 00 and standard deviation of 16.
- Revised and in 1993 = Bayley II comprised of 2 parts:
– MDI (Mental Developmental Index) cognitive and language – PDI (Psychomotor Developmental Index) motor skills. ( y p )
SLIDE 22 Bayley Developmental Index in Premature Survivors
110 120 SD) Advanced Development (Green dash) 100 110 ex (mean± Normal (Pink shaded) 90 mental Inde 70 80 Developm Significantly Delayed Development (Red dash) 60
Period I Period II
Hack M. et al. Pediatrics 1996; 98: 931‐937
SLIDE 23
Cognitive Impairment
Moore T et al. Brit Med J. 2012;345:e7961
SLIDE 24 ELBW Morbidity: Cognitive Delay
80
Pooled Risk Estimate 25.2, 95% CI: 20.4 – 30.5
60 70 40 50
Percent
10 20 30
P
10
SLIDE 25 Logistic regression for MDI <70, ORs and 95% CIs.
Logistic regression Logistic regression Outcome: cognitive delay Risk factors: PVL Grade 3‐4 IVH Early 90’s EPOCH y Postnatal Steroids Male Gender
Vohr BR et al. Pediatrics 2005;116:635‐643
SLIDE 26
ELBW Morbidity ELBW Morbidity Risk Risk 95% CI 95% CI
Acute/NICU Acute/NICU Any ROP 63.7 60.6 – 66.6 Severe ROP 12.3 11.3 – 13.3 Severe ROP IVH (Grade III‐IV) 14.1 13.1 – 15.2 Surgical NEC 10.1 9.3 – 11.0 g Chronic Problems BPD (O2 at 36 weeks) 42.2 40.4 – 43.9 BPD (clinical) 38.7 36.9 – 40.5 Blindness 0.8 0.36 – 1.62 Hearing loss 3.1 2.1 – 4.4 Cerebral Palsy 6.1 4.7 – 7.7 Cognitive Delay 7.4 5.2 – 9.4
SLIDE 27
ELBW Morbidity ELBW Morbidity Risk Risk 95% CI 95% CI
Acute/NICU Acute/NICU Any ROP 63.7 60.6 – 66.6 Severe ROP 12.3 11.3 – 13.3 Severe ROP IVH (Grade III‐IV) 14.1 13.1 – 15.2 Surgical NEC 10.1 9.3 – 11.0 g Chronic Problems BPD (O2 at 36 weeks) 42.2 40.4 – 43.9 BPD (clinical) 38.7 36.9 – 40.5 Blindness 0.8 0.36 – 1.62 Hearing loss 3.1 2.1 – 4.4 Cerebral Palsy 6.1 4.7 – 7.7 Cognitive Delay 7.4 5.2 – 9.4
SLIDE 28
SLIDE 29 Short‐term outcome at discharge for infants with a GA of 24 to 26 wks
Vanhaesebrouck P et al. Pediatrics 2004;114:663‐675
SLIDE 30
Died
27
Died Severe Disability
40
Disability No disability
12
Gestational Age
12
Gestational Age Birth weight Anenatal Steroids Gender Multiple/Singleton Gestation
Tyson JE et al. N Engl J Med 2008; 358:1672‐168
SLIDE 31
http://www nichd nih gov/about/org/der/branches/ppb http://www.nichd.nih.gov/about/org/der/branches/ppb /programs/epbo/pages/epbo_case.aspx
SLIDE 32 ELBW Outcome ELBW Outcome
- Premature birth significant cause of infant mortality and
child morbidity
- US Premature birth rate decreasing now 11.5%
- Viability (50% survival) in developed countries = 23‐24
wks GA
- The smallest infants are at significant risk of death and
disability % li – 30‐50% Mortality – Survivors 40‐80% significant morbidity
SLIDE 33 ELBW Outcome
- CPAP/MV and surfactant increased survival 1980’s early
- CPAP/MV and surfactant increased survival 1980 s early
90’s
- Antenatal steroids improved mortality and morbidity in
- Antenatal steroids improved mortality and morbidity in
late 90’s
- Avoiding postnatal steroids improved morbidity
Avoiding postnatal steroids improved morbidity.
- Each week of GA and each 100 grams birth weight offers
a significant improvement in survival and morbidity a significant improvement in survival and morbidity
- Target O2 to SpO2 of >90%
- Girls do better than boys
Girls do better than boys
- Hospital discharge on the EDC if complications are few.
- Follow up for developmental learning behavioral and
- Follow up for developmental, learning, behavioral and
social problems.
SLIDE 34
SLIDE 35 5‐18% is the range of preterm birth rates across 184 countries of the world the world >80% of preterm births
weeks of gestation and g most of these babies can survive with essential newborn care
World Health Organization: Born too soon: the global action report on preterm birth. WHO Press, Geneva, Switzerland 2012
SLIDE 36 Outcomes of Extremely Low Birth Weight Infants
100 0
Survival per Live Birth Survival per NICU Admission
60 0 80.0 100.0
ercent
1982‐88 1990‐92
60 0 80.0 100.0
rcent p
1982‐88 1990‐92
20 0 40.0 60.0
Survival Pe
20 0 40.0 60.0
Survival Per
1990‐92
0.0 20.0
<50 500 600 700
0.0 20.0
S 00 0‐599 0‐699 0‐749
Hack M et al. Pediatrics 1996;98: 931‐937
SLIDE 37 Premature Birth Global Health Problem
wide = 15 million.
Mortality: – >1 million deaths. – Biggest contribution to infant mortality. y – #2 cause of death under 5 years.
- Morbidity: risk for lifetime of
disability – Motor, sensory, cognitive. C t i 50% f – Component in 50% of long term morbidity.
- Preterm birth increasing in
most countries most countries.
Liu, L. et al. Lancet 2012; 379: 2151‐2161
SLIDE 38 Outcome for Extremely Premature Infants Outcome for Extremely Premature Infants
- Necessary Definitions
- Overview
– Global – National
Survival
NICU – NICU – Infancy/Young childhood
SLIDE 39
Term Definition Time Units
l l d b h l d Gestational age Time elapsed between the first day of the last menstrual period and the Completed weeks p day of delivery Chronological age Time elapsed since birth Days, weeks, th months, years Postmenstrual age Gestational age + chronological age Weeks chronological age Corrected age Chronological age reduced by the number of weeks Weeks, months born before 40 weeks of gestation.
SLIDE 40
- Small for gestational age (SGA):
– Weight less than 10th percentile at given fetal GA. – By definition <2,500 grams at term birth. y , g – Does not distinguish among the various etiologies.
- Large for gestational Age (LGA):
Large for gestational Age (LGA):
– Greater than 90th percentile for duration of gestation. By definition >4 500 grams at term birth – By definition >4,500 grams at term birth – Associated with gestational diabetes, excessive maternal weight gain. maternal weight gain. – More of an issue in the term and late premature infant compared to very premature.
SLIDE 41 WHO, March of Dimes “Born Too Soon” Global Action Report 2012
SLIDE 42
– ‘‘Live Birth’’ complete expulsion p p – After expulsion, breathes, or shows any other evidence of life – Heartbeats distinguished from transient contractions; R i ti di ti i h d f fl ti i t – Respirations distinguished from fleeting respiratory gasps.
- Fetal Death: Also Stillbirth
– ‘‘Fetal death’’ means death prior to the complete expulsion p p p – The death is indicated by: fetus does not breathe or show any other evidence of life, Heartbeats distinguished from transient cardiac contractions; – Heartbeats distinguished from transient cardiac contractions; – Respirations distinguished from fleeting respiratory gasps.
- Stillbirth international comparison definition:
– Birth Weight ≥ 1000 grams or ≥ 28 weeks completed gestation.
- Planned Terminations: Excluded from these definitions and totals.
WHO 1950, revised in 1988 (CDC and National Center for Health Statistics. 1997
SLIDE 43 Infant, neonatal, and post-neonatal mortality rates: United States, 2005–2010 (final) and 2011 (preliminary). ( ) (p y)
Hamilton BE et al Pediatrics 2013;131:548 558 Hamilton BE et al. Pediatrics 2013;131:548‐558
SLIDE 44
– Age of the fetus as length‐of‐pregnancy in weeks – Age of the fetus as length‐of‐pregnancy in weeks – Measured from the first day of the last menstrual period. – Recorded as completed weeks and is never rounded up.
- Estimated date of confinement (EDC): Also “due date”
- Estimated date of confinement (EDC): Also due date
– 40 weeks added to the LMP – Estimated day infant will be born.
- Postmenstrual age (PMA):
- Postmenstrual age (PMA):
– Gestational age plus the time elapsed after birth chronological age – Recorded in weeks Used during the perinatal period beginning after the day of birth – Used during the perinatal period beginning after the day of birth. – Incorrect term: “post‐conceptual” age.
- Corrected age: Also “adjusted age”
Ti f th EDC – Time from the EDC. – Used to describe children up to 3 years who were born preterm. AAP Committee on Fetus and Newborn. PEDIATRICS 2004;114:1362
SLIDE 45
SLIDE 46 L Bi h W i h (LBW)
– <2,500 grams birth weight.
- Very Low Birth Weight (VLBW):
– ≤1,500 grams.
- Extremely Low Birth Weight (ELBW):
– <1,000 grams. <1,000 grams. – Less consistently defined – Designated as 1 000 grams 800 grams 750 grams Designated as 1,000 grams, 800 grams, 750 grams depending on study or reporting agency.
SLIDE 47
Vanhaesebrouck P et al. Pediatrics 2004;114:663‐675
SLIDE 48
Preterm Birth USA
CDC and Prevention, National Center for Health Statistics
SLIDE 49
ELBW Morbidity
60.6/1,000 Live births 39.6/1,000 Live births
Platt MJ et al. Lancet 2007; 371: 43‐50.