Our research focus Cancer research Cancer development / progression - - PowerPoint PPT Presentation

our research focus
SMART_READER_LITE
LIVE PREVIEW

Our research focus Cancer research Cancer development / progression - - PowerPoint PPT Presentation

Our research focus Cancer research Cancer development / progression (e.g. Breast, Ewing's Sarcoma, Osteosarcoma) R package to analyze genomic alterations and Prognostic / therapeutic factors tumor pathways based on array data


slide-1
SLIDE 1

korschi @ uni-muenster.de

Cancer research R package to analyze genomic alterations and tumor pathways based on array data from single nucleotide polymorphism (SNP) and comparative genomic hybridization (CGH) experiments

Eberhard Korsching University Hospital of Münster Gerhard-Domagk-Institute of Pathology

korschi @ uni-muenster.de

# 2

Our research focus

Cancer development / progression (e.g. Breast, Ewing's Sarcoma, Osteosarcoma)

  • Prognostic / therapeutic factors
  • Analysis of the regulatory system on the level of DNA, RNA and

proteins based on

  • Comprehensive sample archive
  • Lab techniques like: TMA, Affymetrix 4C, TaqMan, Cell culture

Development of analysis solutions on this research background Core platform : S-Plus – Fortran, now establishing R – Fortran

korschi @ uni-muenster.de

# 3

Design

nice to have:

  • a data browser

like in S-Plus for the workspace content

  • more concern on

big data sets > 600 MB

  • R to Fortran

translator for time critical calculations

  • or similar

From S-Plus to R – Reasons:

  • Community
  • Technical shortcomings – e.g. S-Plus has memory leaks

Task – migrating from S-Plus to R: Primarily the graphics routines have to be adapted

data sets:

  • parameters / annotations
  • array data
  • ne.line.to.many

... gene.dosage.a gene.dosage.indi adapt.exprSet.toSNP SNP.envelope SNP.envelope.multi SNP.cn.envelope plot.bar.point.segment plot.chromosome.outline cutoff.peaks korschi @ uni-muenster.de

# 4

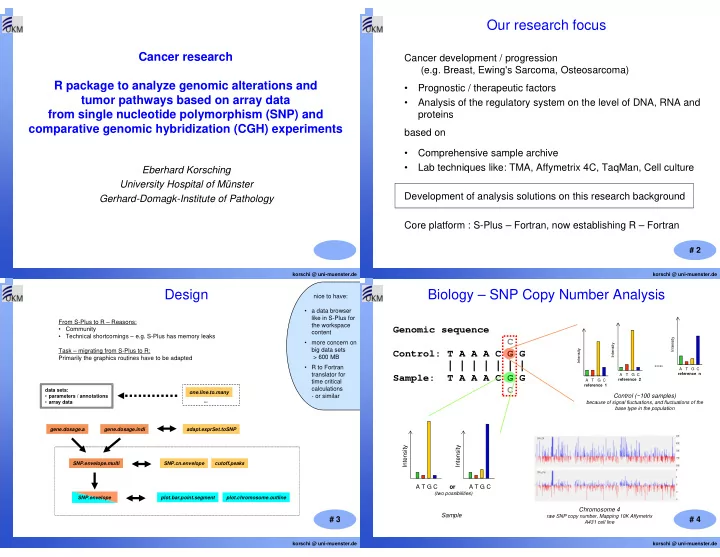
Biology – SNP Copy Number Analysis

Genomic sequence C Control: T A A A C G G | | | | | | | Sample: T A A A C G G C

Intensity Intensity Intensity

.....

A T G C reference n A T G C reference 2 A T G C reference 1

Control (~100 samples)

because of signal fluctuations, and fluctuations of the base type in the population

Chromosome 4

raw SNP copy number, Mapping 10K Affymetrix A431 cell line

Intensity Intensity A T G C or A T G C

(two possibilities)

Sample

slide-2
SLIDE 2

korschi @ uni-muenster.de

# 5

Visualization

114 Mb 16 Mb 1

  • Chr. 13

SNPs: 492 106 Mb 16 Mb 1

  • Chr. 14

SNPs: 401 100 Mb 17 Mb 1

  • Chr. 15

SNPs: 335 89 Mb 38 Mb 1

  • Chr. 16

SNPs: 259 81 Mb 22 Mb 1

  • Chr. 17

SNPs: 188 76 Mb 16 Mb 1

  • Chr. 18

SNPs: 346 65 Mb 28 Mb 1

  • Chr. 19

SNPs: 98 62 Mb 27 Mb 1

  • Chr. 20

SNPs: 222 47 Mb 12 Mb

  • Chr. 21

SNPs: 197 50 Mb 12 Mb

  • Chr. 22

SNPs: 82 155 Mb 59 Mb 1

  • Chr. X

SNPs: 309 245 Mb 124 Mb 1

  • Chr. 1

SNPs: 881 243 Mb 93 Mb 1

  • Chr. 2

SNPs: 962 201 Mb 92 Mb 1

  • Chr. 3

SNPs: 813 191 Mb 51 Mb 1

  • Chr. 4

SNPs: 816 181 Mb 48 Mb 1

  • Chr. 5

SNPs: 780 171 Mb 61 Mb 1

  • Chr. 6

SNPs: 793 159 Mb 59 Mb 1

  • Chr. 7

SNPs: 585 146 Mb 45 Mb 1

  • Chr. 8

SNPs: 556 138 Mb 51 Mb 1

  • Chr. 9

SNPs: 544 135 Mb 40 Mb 1

  • Chr. 10

SNPs: 610 135 Mb 53 Mb 1

  • Chr. 11

SNPs: 644 133 Mb 35 Mb 1

  • Chr. 12

SNPs: 545

SNP copy number across genome

MDA-MB-468 cell line, Mapping 10K Affymetrix, smoothing window: 40 The colored area indicates genetic alterations - Gains: green, losses: red korschi @ uni-muenster.de

# 6

Take home message

  • S-Plus to R is an easy task
  • SNPs are capable to replace the CGH technique
  • Old CGH data can be integrated

Improvements in the Analysis Strategy Make Single Nucleotide Polymorphism Analysis a Powerful Tool in the Detection and Characterization of Amplified Chromosomal Regions in Human Tumors

Eberhard Korschinga Konstantin Agelopolousa Hartmut Schmidta Inka Buchrotha Georg Goshegerb Pia Wülfingc Werner Boeckera Burkhard Brandtd Horst Buergera Institutes of a Pathology and b Orthopedics and c Department of Gynecology, University of Münster, Münster, and

d Institute of Tumor Biology, University of Hamburg, Hamburg , Germany

Pathobiology 2006;73: (DOI:10.1159/000093088) Cooperation with: Walter Nadler Complex Systems Research Group, John von Neumann Institute for Computing, Research Centre Jülich, Germany & Computational Nano- and Biophysics Group, Department of Physics, Michigan Technological University, USA korschi @ uni-muenster.de

# 7

  • korschi @ uni-muenster.de

# 8

Biology – CGH vs. SNP Analysis

Comperative Genomic Hybridisation

slide-3
SLIDE 3

korschi @ uni-muenster.de

# 9

Results I

191 Mb 51 Mb 1

  • 0 +

191 Mb 51 Mb 1

  • 0 +

191 Mb 51 Mb 1

  • 0 +

CGH SNP smoothing window 50 SNP smoothing window 20 SNP smoothing window 1

159 Mb 59 Mb 1

  • 0 +

159 Mb 59 Mb 1

  • 0 +

159 Mb 59 Mb 1

  • 0 +

korschi @ uni-muenster.de

# 10

Results II

100% tumour DNA 80% tumour DNA 60% tumour DNA 40% tumour DNA 20% tumour DNA 76 Mb 16 Mb 1

  • 0+
  • Chr. 18

SNPs: 346 76 Mb 16 Mb 1

  • 0+
  • Chr. 18

SNPs: 346 76 Mb 16 Mb 1

  • 0+
  • Chr. 18

SNPs: 346 76 Mb 16 Mb 1

  • 0+
  • Chr. 18

SNPs: 346 76 Mb 16 Mb 1

  • 0+
  • Chr. 18

SNPs: 346