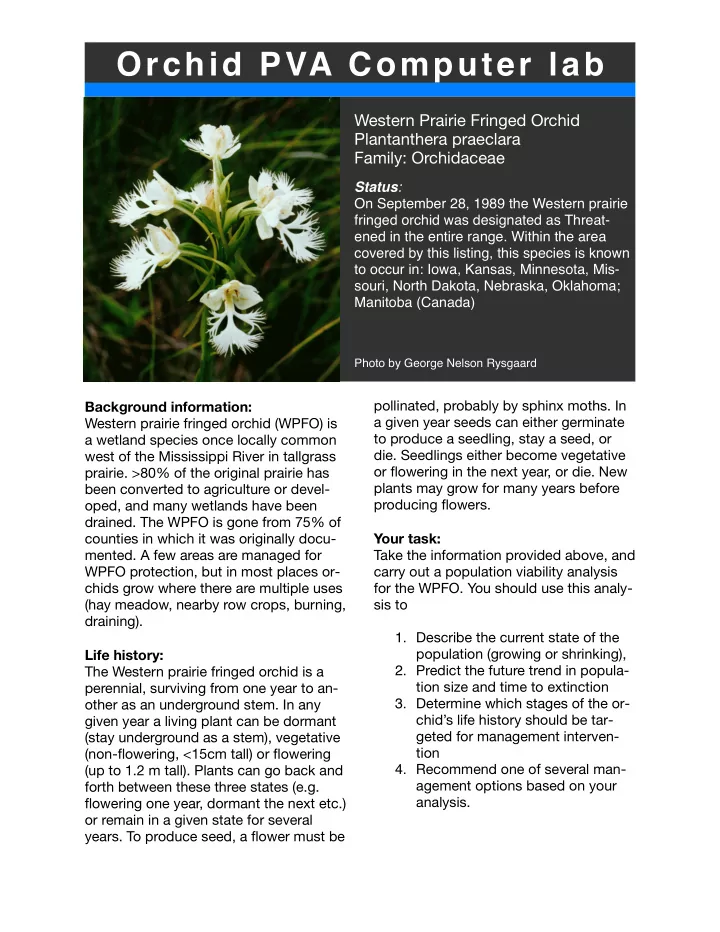

Western Prairie Fringed Orchid Plantanthera praeclara Family: Orchidaceae
Status: On September 28, 1989 the Western prairie fringed orchid was designated as Threat- ened in the entire range. Within the area covered by this listing, this species is known to occur in: Iowa, Kansas, Minnesota, Mis- souri, North Dakota, Nebraska, Oklahoma; Manitoba (Canada)
Photo by George Nelson Rysgaard
Background information: Western prairie fringed orchid (WPFO) is a wetland species once locally common west of the Mississippi River in tallgrass
- prairie. >80% of the original prairie has
been converted to agriculture or devel-
- ped, and many wetlands have been
- drained. The WPFO is gone from 75% of
counties in which it was originally docu-
- mented. A few areas are managed for
WPFO protection, but in most places or- chids grow where there are multiple uses (hay meadow, nearby row crops, burning, draining). Life history: The Western prairie fringed orchid is a perennial, surviving from one year to an-
- ther as an underground stem. In any
given year a living plant can be dormant (stay underground as a stem), vegetative (non-flowering, <15cm tall) or flowering (up to 1.2 m tall). Plants can go back and forth between these three states (e.g. flowering one year, dormant the next etc.)
- r remain in a given state for several
- years. To produce seed, a flower must be
pollinated, probably by sphinx moths. In a given year seeds can either germinate to produce a seedling, stay a seed, or
- die. Seedlings either become vegetative
- r flowering in the next year, or die. New
plants may grow for many years before producing flowers. Your task: Take the information provided above, and carry out a population viability analysis for the WPFO. You should use this analy- sis to
- 1. Describe the current state of the
population (growing or shrinking),
- 2. Predict the future trend in popula-
tion size and time to extinction
- 3. Determine which stages of the or-
chid’s life history should be tar- geted for management interven- tion
- 4. Recommend one of several man-
agement options based on your analysis.