
SLIDE 1
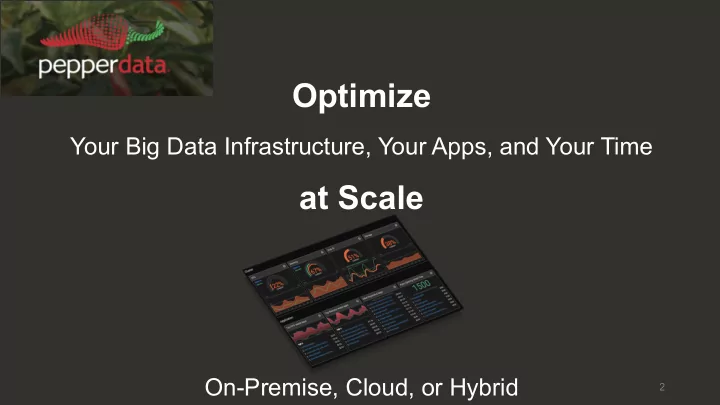
Optimize
Your Big Data Infrastructure, Your Apps, and Your Time
at Scale
On-Premise, Cloud, or Hybrid
2
Optimize Your Big Data Infrastructure, Your Apps, and Your Time at - - PowerPoint PPT Presentation
Optimize Your Big Data Infrastructure, Your Apps, and Your Time at Scale On-Premise, Cloud, or Hybrid 2 Pep Agent | Get ALL of the metrics NODE NODE NODE 1 2 3 A Pep Agent on every node This unique real-time data is This unique
2
NODE 1 NODE 2 NODE 3
A Pep Agent on every node Continuously collects hundreds of metrics in real- time across the entire stack. This unique real-time data is Correlated and powers Platform Spotlight and Application Spotlight. This unique real-time data also powers auto-tuning for capacity and application performance optimization Each Pep Agent is 1% of a single core and roughly 300 MB of RAM per node
7
8
Counters JMX Metrics Custom Metrics User Activity Data Event and Performance Data Kernel Metrics Cluster Metrics
NODE 3 NODE 2 NODE 1
Auto Actions
8
Query Table Database Query Spotlight
2
2