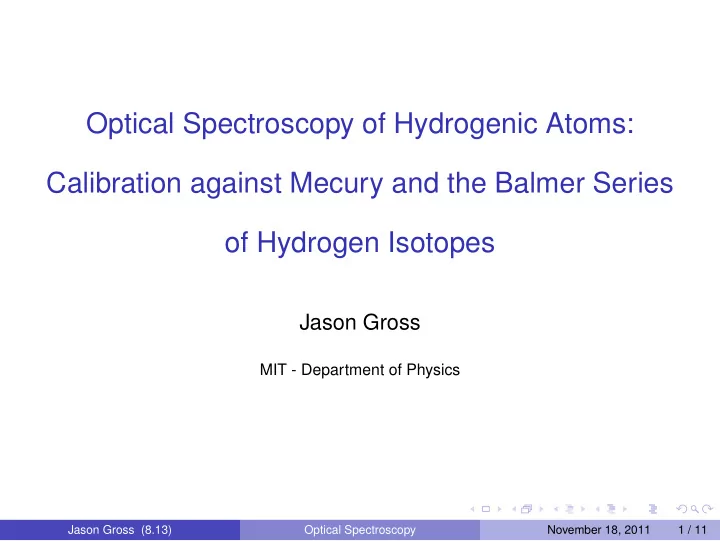

Optical Spectroscopy of Hydrogenic Atoms: Calibration against Mecury and the Balmer Series of Hydrogen Isotopes Jason Gross MIT - Department of Physics Jason Gross (8.13) Optical Spectroscopy November 18, 2011 1 / 11
Goals test the Balmer-Bohr formula: � 1 � 1 − 1 λ = R H n 2 n 2 f i determine the value of the Rydberg constant R ∞ R H = 1 + m e / M determine the hydrogen-deuterium mass-ratio Jason Gross (8.13) Optical Spectroscopy November 18, 2011 2 / 11
Goals test the Balmer-Bohr formula: � 1 � 1 − 1 λ = R H n 2 n 2 f i determine the value of the Rydberg constant R ∞ R H = 1 + m e / M determine the hydrogen-deuterium mass-ratio Jason Gross (8.13) Optical Spectroscopy November 18, 2011 2 / 11
Goals test the Balmer-Bohr formula: � 1 � 1 − 1 λ = R H n 2 n 2 f i determine the value of the Rydberg constant R ∞ R H = 1 + m e / M determine the hydrogen-deuterium mass-ratio Jason Gross (8.13) Optical Spectroscopy November 18, 2011 2 / 11
Bohr Model Jason Gross (8.13) Optical Spectroscopy November 18, 2011 3 / 11
Balmer Series Hydrogen Energy Level Diagram E � eV � 0 n � 3; E � � 1.51174 eV 4. � 10 3 � 4. � 10 3 � 4. � 10 3 � 4. � 10 3 � 4. � 103 � 4. � 103 � 4. � 103 � 4. � 103 � 4. � 103 � 4. � 103 � 4. � 103 � 4. � 103 � 4. � 103 � 4. � 103 � 4. � 103 � 4. � 103 � 4. � 103 � 4. � 103 � 4. � 103 � 4. � 103 � 4. � 103 � 4. � 103 � 4. � 103 � 4. � 103 � 4. � 103 � 4. � 103 � 4. � 103 � 4. � 103 4. � 103 � 4. � 103 � 4. � 103 � 4339.37 � 4. � 103 4. � 103 4. � 103 4. � 10 3 4. � 10 4. � 103 4. � 103 4. � 103 4. � 103 4. � 103 4. � 103 4. � 103 4. � 103 4. � 103 3 4860.09 � � 2 6561.12 � n � 2; E � � 3.40142 eV � 4 � 6 � 8 � 10 � 12 n � 1; E � � 13.6057 eV Jason Gross (8.13) Optical Spectroscopy November 18, 2011 4 / 11
Experimental Setup Grating PMT Light Source Spherical Mirrors Jason Gross (8.13) Optical Spectroscopy November 18, 2011 5 / 11
Mercury Spectrum Jason Gross (8.13) Optical Spectroscopy November 18, 2011 6 / 11
Hydrogen Peak Deuterium Balmer Plot � Uncorrected Λ � Counts 5000 Residuals 4000 3000 2 � 1.9 Χ Ν Μ D � � 3883.8244 � 0.0003 � � Μ H � � 3885.0185 � 0.0004 � � 2000 1000 Λ � � � 3883.5 3884.0 3884.5 3885.0 3885.5 Jason Gross (8.13) Optical Spectroscopy November 18, 2011 7 / 11
Rydberg Constant Book Value: 0.00109737 − 1 Balmer Series for Hydrogen Λ � � � 8000 Residuals 7000 6000 2 � 7.3 � 10 8 Χ Ν R H � � 0.0010997 � 8. � 10 � 7 � � 5000 4000 n 4 6 8 10 Jason Gross (8.13) Optical Spectroscopy November 18, 2011 8 / 11
Rydberg Constant Balmer Series for Deuterium Λ � � � 8000 Residuals 7000 6000 2 � 7.8 � 10 8 Χ Ν R D � � 0.0011000 � 8. � 10 � 7 � � 5000 4000 n 4 6 8 10 Jason Gross (8.13) Optical Spectroscopy November 18, 2011 9 / 11
Mass Ratio Book Value: 1 + m e / M D 1 + m e / M H = 0 . 999724 Our Value: 1 + m e / M D 1 + m e / M H = 0 . 9997 ± 0 . 0010 Jason Gross (8.13) Optical Spectroscopy November 18, 2011 10 / 11
Thank You Any questions? Jason Gross (8.13) Optical Spectroscopy November 18, 2011 11 / 11
Recommend
More recommend