
2017 2018 Change Change OTHER INDIAN AFFAIRS 2016 2017 Planning Internal Fixed Program President's from from TPA CENTRAL REGIONAL PROGRAMS/ Enacted Enacted Baseline Transfers Costs Changes Budget 2017 2017 PROJECTS Request Baseline Enacted
OPERATION OF INDIAN PROGRAMS
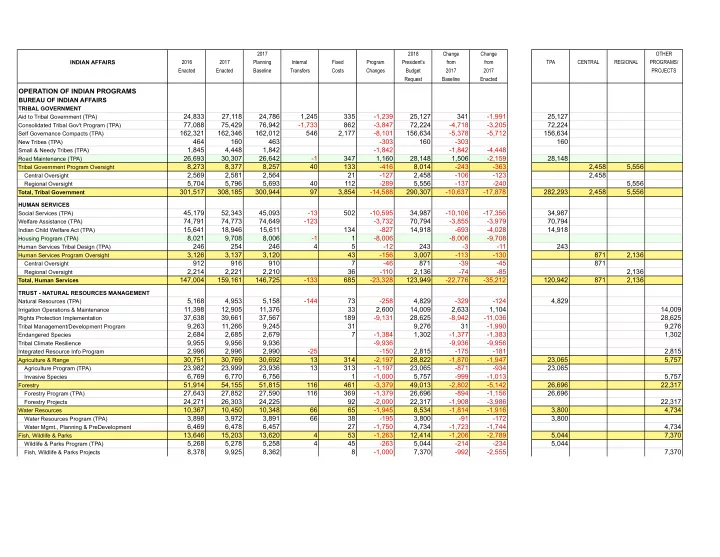
BUREAU OF INDIAN AFFAIRS
TRIBAL GOVERNMENT Aid to Tribal Government (TPA)
24,833 27,118 24,786 1,245 335
- 1,239
25,127 341
- 1,991
25,127
Consolidated Tribal Gov't Program (TPA)
77,088 75,429 76,942
- 1,733
862
- 3,847
72,224
- 4,718
- 3,205
72,224
Self Governance Compacts (TPA)
162,321 162,346 162,012 546 2,177
- 8,101
156,634
- 5,378
- 5,712
156,634
New Tribes (TPA)
464 160 463
- 303
160
- 303
160
Small & Needy Tribes (TPA)
1,845 4,448 1,842
- 1,842
- 1,842
- 4,448
Road Maintenance (TPA)
26,693 30,307 26,642
- 1
347 1,160 28,148 1,506
- 2,159
28,148
Tribal Government Program Oversight
8,273 8,377 8,257 40 133
- 416
8,014
- 243
- 363
2,458 5,556
Central Oversight
2,569 2,581 2,564 21
- 127
2,458
- 106
- 123
2,458
Regional Oversight
5,704 5,796 5,693 40 112
- 289
5,556
- 137
- 240
5,556
Total, Tribal Government
301,517 308,185 300,944 97 3,854
- 14,588
290,307
- 10,637
- 17,878
282,293 2,458 5,556
HUMAN SERVICES Social Services (TPA)
45,179 52,343 45,093
- 13
502
- 10,595
34,987
- 10,106
- 17,356
34,987
Welfare Assistance (TPA)
74,791 74,773 74,649
- 123
- 3,732
70,794
- 3,855
- 3,979
70,794
Indian Child Welfare Act (TPA)
15,641 18,946 15,611 134
- 827
14,918
- 693
- 4,028
14,918
Housing Program (TPA)
8,021 9,708 8,006
- 1
1
- 8,006
- 8,006
- 9,708
Human Services Tribal Design (TPA)
246 254 246 4 5
- 12
243
- 3
- 11
243
Human Services Program Oversight
3,126 3,137 3,120 43
- 156
3,007
- 113
- 130
871 2,136
Central Oversight
912 916 910 7
- 46
871
- 39
- 45
871
Regional Oversight
2,214 2,221 2,210 36
- 110
2,136
- 74
- 85
2,136
Total, Human Services
147,004 159,161 146,725
- 133
685
- 23,328
123,949
- 22,776
- 35,212
120,942 871 2,136
TRUST - NATURAL RESOURCES MANAGEMENT Natural Resources (TPA)
5,168 4,953 5,158
- 144
73
- 258
4,829
- 329
- 124
4,829
Irrigation Operations & Maintenance
11,398 12,905 11,376 33 2,600 14,009 2,633 1,104 14,009
Rights Protection Implementation
37,638 39,661 37,567 189
- 9,131
28,625
- 8,942
- 11,036
28,625
Tribal Management/Development Program
9,263 11,266 9,245 31 9,276 31
- 1,990
9,276
Endangered Species
2,684 2,685 2,679 7
- 1,384
1,302
- 1,377
- 1,383
1,302
Tribal Climate Resilience
9,955 9,956 9,936
- 9,936
- 9,936
- 9,956
Integrated Resource Info Program
2,996 2,996 2,990
- 25
- 150
2,815
- 175
- 181
2,815
Agriculture & Range
30,751 30,769 30,692 13 314
- 2,197
28,822
- 1,870
- 1,947
23,065 5,757
Agriculture Program (TPA)
23,982 23,999 23,936 13 313
- 1,197
23,065
- 871
- 934
23,065
Invasive Species
6,769 6,770 6,756 1
- 1,000
5,757
- 999
- 1,013
5,757
Forestry
51,914 54,155 51,815 116 461
- 3,379
49,013
- 2,802
- 5,142
26,696 22,317
Forestry Program (TPA)
27,643 27,852 27,590 116 369
- 1,379
26,696
- 894
- 1,156
26,696
Forestry Projects
24,271 26,303 24,225 92
- 2,000
22,317
- 1,908
- 3,986
22,317
Water Resources
10,367 10,450 10,348 66 65
- 1,945
8,534
- 1,814
- 1,916
3,800 4,734
Water Resources Program (TPA)
3,898 3,972 3,891 66 38
- 195
3,800
- 91
- 172
3,800
Water Mgmt., Planning & PreDevelopment
6,469 6,478 6,457 27
- 1,750
4,734
- 1,723
- 1,744
4,734
Fish, Wildlife & Parks
13,646 15,203 13,620 4 53
- 1,263
12,414
- 1,206
- 2,789
5,044 7,370
Wildlife & Parks Program (TPA)
5,268 5,278 5,258 4 45
- 263
5,044
- 214
- 234
5,044
Fish, Wildlife & Parks Projects
8,378 9,925 8,362 8
- 1,000
7,370
- 992
- 2,555
7,370