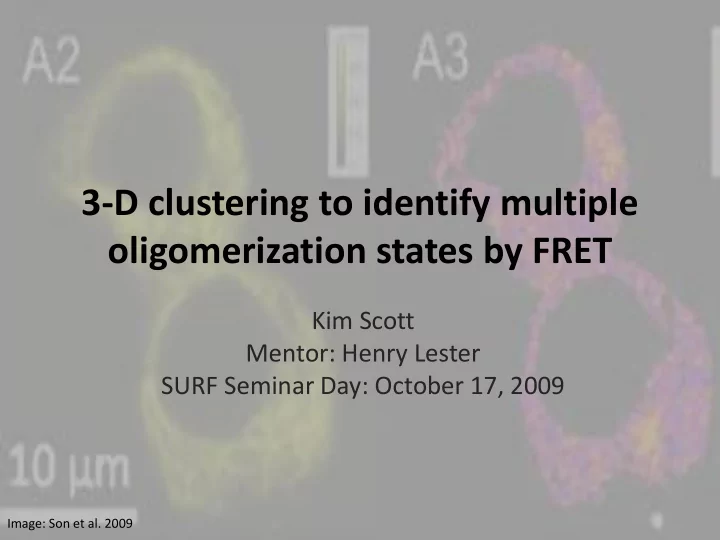

3-D clustering to identify multiple oligomerization states by FRET Kim Scott Mentor: Henry Lester SURF Seminar Day: October 17, 2009 Image: Son et al. 2009
Nicotinic Acetylcholine Receptors (nAChRs) ( α 4) 3 ( β 2) 2 : • Pentameric ion channels found EC50 ~100μM throughout the brain α • Composed of a variety of possible β β subunits in varying stoichiometries • Open in response to acetylcholine α α (naturally), nicotine (much stronger!) α • Presumed to underlie the β β mechanisms of nicotine addiction, tolerance, & withdrawal… plus its β α protective effect against Parkinson’s ( α 4) 2 ( β 2) 3 : 100 times as sensitive! 2
FRET microscopy FRET no FRET (Wang et al., 2008) (Vogel et al., 2006) 3
Extending FRET to study stoichiometry Donor Acceptor FRET Goal: to estimate the prevalence of distinct nAChR stoichiometries from the distributions of donor, acceptor, and net FRET pixel values. (Son et al., 2009) Challenges: • Multiple stoichiometries of assembled receptors, partially assembled receptors of unknown geometry, and unpaired donors and acceptors all present. • Heterogeneous population even within single pixels • Unknown subcellular localization of FRETing oligomers 4
Raw data Current NFRET unmixing histogram analysis FRET donor (D) acceptor (A) PixFRET bleedthrough compensation net FRET (nF) normalization: nF A D Fig 8H, Moss et al., submitted to JGP NFRET 5
Dangers of fitting NFRET histograms nF NFRET Single oligomer NFRET A D values with (Xia and Liu, 2001) nF ~ N(1, 0.2) A ~ N(10, 4) D ~ N(10, 4) 1) NFRET distribution from a single oligomer with varying nF, A, and D measurements is skew. 6
Dangers of fitting NFRET histograms nF NFRET A D (Xia and Liu, 2001) Given that a fraction f of the total FRETing constructs are of type A, the NFRET value T( f) = 2) NFRET from multiple species combines nonlinearly (sometimes non-monotonically) 7
Dangers of fitting NFRET histograms Two independently normally-distributed species with fixed nF, A, and D values per oligomer: ←A:B ratio 3) Even “ideal” situations (with no variation in nF, A, and D) give skew distributions of NFRET values. 8
The case for direct clustering instead Raw data • Why collapse 3D unmixing information to 1D FRET unnecessarily? donor (D) acceptor (A) • Clustering automatically PixFRET bleedthrough assigns pixels to compensation populations. net FRET (nF) • Deals more readily with normalization: unpaired fluorescence. nF A D NFRET 9
Two pure population model 80 70 30 60 25 20 50 net FRET 15 Pixels 40 10 30 5 0 20 300 300 200 10 200 100 100 0 Donor 0.06 0.08 0.1 0.12 0.14 0.16 0 0 Acceptor NFRET Species A, mean NFRET 0.1: nF ~ N(1, 0.2) A ~ N(7, 0.7) D ~ N(14, 1.4) Species B, mean NFRET 0.125: nF ~ N(1.25, .25) A ~ N(14, 1.4) D ~ N(7, 0.7) 10
Segments with unpaired donor/acceptor • Same species A and B, concentrations [100 50 50] and [ 50 100 50] • Total unpaired concentration [ 25 25 25] • Unpaired fluorophores have same properties as lesser of donor & acceptor in FRETing species 11
Choice of clustering algorithm • Projective k-means – Clusters points along lines (representing varying concentrations of a single ratio of species, plus unpaired fluorescence) – Doesn’t split high - and low-concentration regions • Gaussian mixture (GM) model – Fits points to a set of Gaussian clusters – Doesn’t ignore concentration – May be more robust to impure “segmentation” Both easily extended to probabilistic clustering. 12
Performance of GM clustering 25 images each, 2000 pixels per image. 20% uncertainty in nF, 10% in A and D Average concentration 10 oligomers (small) in both populations. 13
Performance of GM clustering • Accurately and reproducibly clusters pixels from pure-population and segmented models, even with unpaired fluorescence • Consistently identifies the number of clusters using Bayesian information criterion (introduces a parameter penalty to avoid overfitting) 14
Next steps • Next focus is on clustering real data from two experiments: with three and one putative populations of nAChRs • Use of membrane-specific and non-FRETing distributions to calibrate expected clusters • Modeling varied transfection ratios and matching clusters across cells 15
Acknowledgments Henry Lester Fraser Moss Rigo Pantoja Rahul Srinivasan Crystal Dilworth Lester lab Amgen Foundation Caltech SFP office 16
Recommend
More recommend