Ohio DOT Infrastructure Resiliency Plan January 27, 2017 Overview - - PowerPoint PPT Presentation

ohio dot infrastructure resiliency plan
SMART_READER_LITE
LIVE PREVIEW

Ohio DOT Infrastructure Resiliency Plan January 27, 2017 Overview - - PowerPoint PPT Presentation

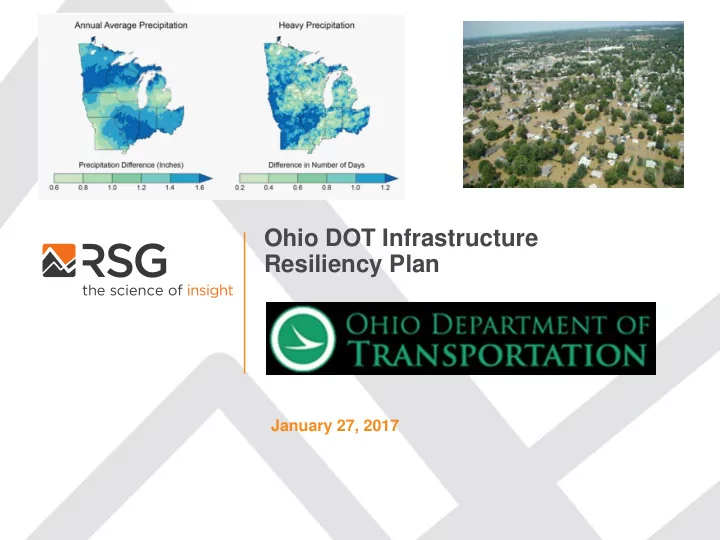
Ohio DOT Infrastructure Resiliency Plan January 27, 2017 Overview Ohio DOT Infrastructure Resiliency Plan Motivation Related Initiatives Climate Effects Expected in Ohio Special Topics Determining Asset Vulnerability Recommendations


slide-1
SLIDE 1

Ohio DOT Infrastructure Resiliency Plan

January 27, 2017

slide-2
SLIDE 2

2 8-31-2016

Overview – Ohio DOT Infrastructure Resiliency Plan

Motivation Related Initiatives Climate Effects Expected in Ohio Special Topics Determining Asset Vulnerability Recommendations

slide-3
SLIDE 3

3 8-31-2016

Motivation for the Resiliency Plan

To conduct systems-level vulnerability and risk assessment of the ODOT’s infrastructure that will likely be impacted by climate change effects. Time frame – 2100.

slide-4
SLIDE 4

4 8-31-2016

Related Initiatives in Ohio

  • Ohio River Basin Climate Change

Project

  • US Army Corps of Engineers,

NOAA/NWS, USGS, EPA

  • Sustaining Scioto-Columbus, OH

region, focus on water supply and quality

  • >20 Similar Efforts by Other State

DOTs

slide-5
SLIDE 5

5 8-31-2016

Intergovernmental Panel on Climate Change

  • Climate Projections
slide-6
SLIDE 6

6 8-31-2016

Likely Climate Change Effects

From: TRB Special Report 290

  • Increases in very hot days and

heat waves – very likely (>90%)

  • Rising sea levels – virtually

certain (>99%)

  • Increases in Arctic temperature

– virtually certain (>99%)

  • Increases in intense

precipitation events – very likely (>90%)

  • Increases in hurricane intensity
  • - likely (>66%)
slide-7
SLIDE 7

7 8-31-2016

Projected Changes in Ohio Climate – US Army Corps of Engineers (ORBCC)

Gradual Event-Driven

Increasing Average Temperatures x Increased Drought Duration x Reduced Lake Erie Water Levels x Increased Frequency of Heavy Precipitation Events x

Low High +50 Years 2.5 5.0 +100 Years 4.5 7.0 IPCC Scenario A1B (Mid GHG Emissions)

Projected Average Annual Temperature Increase, Ohio (F)

slide-8
SLIDE 8

8 8-31-2016

Impacts of Warmer Temps – Some “+”s and “–”s

Warmer Winters =

  • reductions in snow and ice removal costs;
  • reduced environmental impacts from the use of salt and chemicals on

roads and bridges;

  • extend the construction season;
  • improve the mobility and safety of passenger and freight travel

through reduced winter hazards.

Hotter Summers =

  • Limit on construction activities and the hours road crews can work

due to health and safety concerns for highway workers.

  • Load restrictions on roads.
  • Pavement damage and buckling will disrupt vehicle movements.
  • Extreme heat could disrupt vehicle operations because of overheating

and increased risk of tire blowouts in heavily loaded vehicles.

slide-9
SLIDE 9

9 8-31-2016

ODOT Special Topics

  • 1. Impacts of Extreme Heat
  • n Pavements
  • 2. Impacts on Air Quality
  • 3. Lake Erie Water Levels
  • 4. Potential Opening of the

Northwest Passage

slide-10
SLIDE 10

10 8-31-2016

Special Topic #1: Impacts to Pavements – Key Findings

1. Pavement modeling generally suggests pavement impacts will be minimal and that there are many ways to adapt pavements to climate change effects, if necessary. 2. ODOT-maintained highways are not typically constructed on expandable clay soils within the pavement structure profile. 3. However, secondary roads maintained by counties or other jurisdictions may be vulnerable to projected drought- inundation cycles due to lower design standards.

slide-11
SLIDE 11

11 8-31-2016

Special Topic #2” Impacts to Air Quality Ohio currently has 3 Ozone Non-Attainment Areas:

Cincinnati-Hamilton Cleveland-Akron-Lorain Columbus Anticipated tightening of Ozone standard to 70ppm. Likely increase in the degree and extent of Non-Attainment.

slide-12
SLIDE 12

12 8-31-2016

Special Topic #3” Lake Erie Water Levels

slide-13
SLIDE 13

13 8-31-2016

Special Topic #4” Northwest Passage

slide-14
SLIDE 14

14 8-31-2016

Special Topic #4” Northwest Passage

slide-15
SLIDE 15

15 8-31-2016

Vulnerability Assessment

slide-16
SLIDE 16

16 8-31-2016

Precipitation Projections for the Midwest, 2041-2070 Relative to 1971-2000, National Climate Assessment

slide-17
SLIDE 17

17 8-31-2016

Projected Climate Effect – Increasing Variability of Precipitation & Stream Flows

slide-18
SLIDE 18

18 8-31-2016

FHWA Vulnerability Model - Three Components

slide-19
SLIDE 19

19 8-31-2016

Vulnerability to Flooding – Bridges and Culverts

slide-20
SLIDE 20

20 8-31-2016

10 Most Vulnerable Bridges from Vulnerability Modeling

Asset ID Bridge Location Description Score (Rank#)

4822 NB I 75 (RILEY CREEK) 2.64 (1) 4823 SB I 75 (RILEY CREEK) 2.64 (2) 2228 I.R.475 00475 (OTTAWA RIVER) 2.62 (3) 4056 US 62 3.09 MI W OF SR 165 (BR MAHONING RIVER) 2.5 (4) 2144 US 224 0.70 MI E OF SR 625 (MILL CREEK) 2.48 (5) 2132 US 62 0.47 MI W OF SR 289 (SR 289 MAH R & CSX&NS RR) 2.45 (6) 2143 US 224 0.80 MI E OF SR 625 (MILL CREEK) 2.44 (7) 785 US 62 4.13 MI E OF SR 173 (OVR SR183 RR CRK&GASKILL) 2.43 (8) 786 US 62 4.13 MI E OF SR 173 (OVR SR183 RR CRK&GASKILL) 2.42 (9) 751 SR 619 2.24 MI W OF SR 183 (LITTLE BEECH CREEK) 2.42 (10)

slide-21
SLIDE 21

21 8-31-2016

Vulnerability to Flooding – Highways

Previous Flooding Issues Length at Risk of Erosion Percent Not Wetlands or Lakes Percent Urban Stream Flow Increase Rain Fall Increase Pavement Condition Rating Sensitivity Score AADT Truck AADT Stategic Transporation System Distance to Critical Facilities Exposure Score Adaptive Capacity Score Vulnerability Score

Normalize, Weight, and Average Weight and Average

slide-22
SLIDE 22

22 8-31-2016

Most Vulnerable Highway Segments

slide-23
SLIDE 23

23 8-31-2016

Most Vulnerable Highway Segments

Asset ID Rank Highway Segment Vulnerability Location Description Map Image 115 1 2.75 Highway 33, St. Mary's, OH 102 2 2.74 Highway 33, St. Mary's, OH 106 3 2.55 Highway 7, Martins Ferry, OH 121 4 2.55 Highway 7, Martins Ferry, OH

slide-24
SLIDE 24

24 8-31-2016

Asset ID Rank Highway Segment Vulnerability Location Description Map Image 50 5 2.54 Highway 50 (Appalachian Hwy), east of Athens 45 6 2.52 Highway 50 (Appalachian Hwy), east of Athens 21 7 2.5 Highway 50 (Appalachian Hwy), east of Athens 312 8 2.49 Highway 33, Long Street, north of Scioto River 79 9 2.48 Highway 50 (Appalachian Hwy), east of Athens

shown above with #6 and #7

605 10 2.48 I-280, southeast of Toledo

slide-25
SLIDE 25

25 8-31-2016

ODOT Emergency Response – Gary McVoy

“ODOT seems relatively well equipped and prepared to respond to the threats posed by extreme weather as they might affect the ODOT system.”

  • 1. Follow-up with districts which expressed a potential for improvement in

each of the topic areas surveyed, in order to understand what can and should be done in light of this information.

  • 2. Implementation of formal “after action” reviews as an essential component
  • f the Incident Command Structure (ICS).
slide-26
SLIDE 26

26 8-31-2016

Recommendations

  • Designate a specialist within ODOT to manage a divisional cross-cutting effort

to maintain the Department’s focus on vulnerability to climate change impacts to core infrastructure – logical lead is within Office of Planning.

  • Annual Tasks of the Resiliency Lead (selected items):

– Issues, data collection and analysis that need to be monitored on an ongoing basis, as part of input to ODOT’s transportation planning function. – What climate stressors will affect the proposed facility either directly or through effects on the surrounding ecology? – Integration of Vulnerability Assessment into Project Scoping/Design

slide-27
SLIDE 27

27 8-31-2016

Recommendations

  • Develop Strategies for Protecting the Function of Identified

Vulnerable Assets

Planning Environmental Analysis Design Standards Infrastructure Retrofit/Maintenance Operations Public Outreach/Communications

slide-28
SLIDE 28

28 8-31-2016

Recommendations

  • Ongoing refinement of VAST model for the 3 asset types (highways,

bridges, culverts): – Initial refinement of scales and weights in VAST model based on input from Districts. – Annual inspection visit to the top ranked vulnerable assets in each asset

  • class. Revise VAST model as necessary to conform to best

data/knowledge from USGS and from field inspections. – Update list of critical facilities, re-run VAST to determine whether there is a different prioritization of assets.

slide-29
SLIDE 29

29 8-31-2016

Recommendations

  • Interagency Coordination:

– Coordinate with ODOT Emergency Transportation Operations – Follow-up with districts which expressed a potential for improvement in each of the topic areas surveyed, in order to understand what can and should be done in light of this information. – Implementation of formal “after action” reviews as an essential component of the continuous improvement philosophy under the Incident Command Structure (ICS) / Continuity of Operations / Continuity Program Management Cycle (https://www.fema.gov/continuity-operations) – Coordinate with ODOT Asset Management, – Develop advisory team of ODOT and extra-ODOT, including climate scientists from USGS/NWS.

slide-30
SLIDE 30

30 8-31-2016

Project Contacts

  • Matt Perlik, ODOT Office of Environmental Service,

matthew.Perlik@dot.ohio.gov

  • Noel Alcala, ODOT Office of Environmental Services,

noel.alcala@dot.ohio.gov

  • Robert Chamberlin, RSG, rchamberlin@rsginc.com