
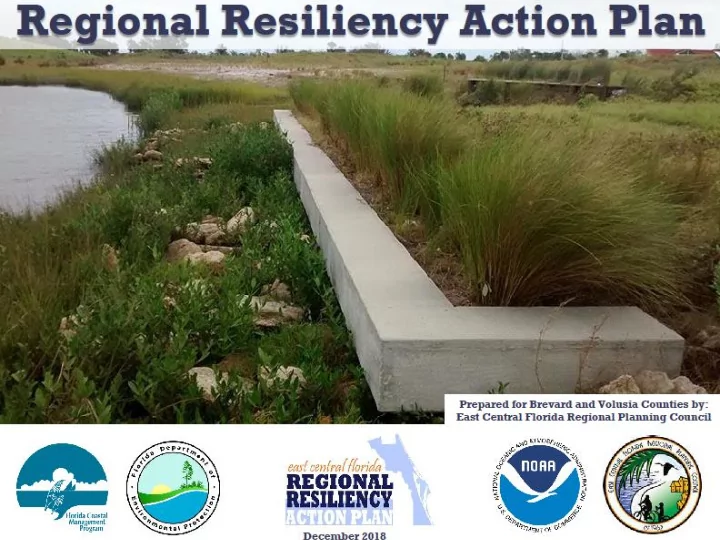
SLIDE 1
EAST CENTRAL FLORIDA REGIONAL RESILIENCY ACTION PLAN
1
REGIONAL RESILIENCY ACTION PLAN 1 2 East Central Florida - - PowerPoint PPT Presentation
EAST CENTRAL FLORIDA REGIONAL RESILIENCY ACTION PLAN 1 2 East Central Florida Regional Resiliency Action Plan Steering Committee Agency Agency Brevard County GIS Indian River Lagoon Council Brevard County Planning Kennedy Space
1
2
Agency Agency
Brevard County GIS Indian River Lagoon Council Brevard County Planning Kennedy Space Center/NASA Brevard County Public Works League of Women Voters Sustainability Committee Brevard Emergency Management NOAA Brevard Natural Resources RW Parkinson Inc. Canaveral Port Authority Patrick Air Force Base City of Cape Canaveral River to Sea TPO City of New Smyrna Beach Sea Grant City of Port Orange SJRWMD City of Satellite Beach Space Coast TPO Deady Law Stetson University East Central Florida Regional Planning Council UF Geoplan FEMA UF IFAS Volusia and Brevard Florida Department of Economic Opportunity USACE Florida Department of Environmental Protection Volusia County Emergency Management Florida Department of Health Brevard Volusia County Growth Management Florida Department of Health Volusia Volusia County Stormwater Florida Department of Transportation Volusia County Traffic Engineering Florida Fish and Wildlife Commission Volusia County Water Resources and Utilities Florida Institute of Technology USDA
4
5
6
7
100 Resilient Cities Framework
8
9
10
11
13
14
15
stakeholders about resilience. Specifically budget for long-term impacts and solutions
vulnerabilities to future conditions
Develop regional collaboration and strategies for resilience
Increase the manufacturing labor pool and skills for new technologies
Work with small businesses to better
prepare for disasters
16
17
18
19
20
21
22
23
agencies to address financial side of resiliency
especially in transit dependent communities
between the business community and the local government to help small businesses
24
especially for flooding
stormwater and address high nutrient loading into natural systems
benefits of conservation lands
25
Ensure water supply and stormwater infrastructure are protected Protect residents by discouraging
include specific line items to be proactive in creating sustainable and resilient communities
residents
26
budgets, political agendas, term limits, lobbyists, and lack of education
leadership and have a succession plan and focus on keeping the end goal in mind
continuous format
27
ECF REGIONAL RESILIENCY ACTION PLAN RECOMMENDED BOUNDS FOR PLANNING FOR SEA LEVEL RISE
28 Upper r bound nd Lower r bound nd
NEXT STEPS
29
30
WWW.PERILOFFLOOD.NET
Tara McCue, AICP ECFRPC Director of Planning and Community Development Tara@ecfrpc.org www.perilofflood.net www.ecfrpc.org