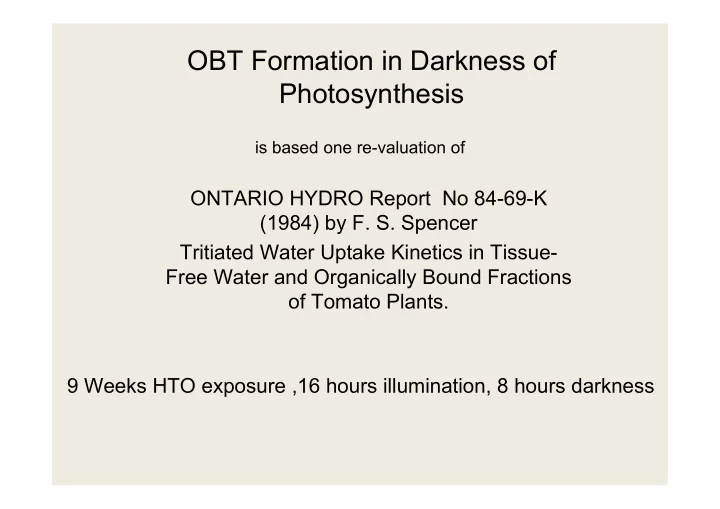

OBT Formation in Darkness of Photosynthesis is based one re-valuation of ONTARIO HYDRO Report No 84-69-K (1984) by F. S. Spencer Tritiated Water Uptake Kinetics in Tissue- Free Water and Organically Bound Fractions of Tomato Plants. 9 Weeks HTO exposure ,16 hours illumination, 8 hours darkness
OBT Data of Tomato Plants During 9 Weeks of HTOExposure 35.000 30.000 25.000 20.000 OBT[pCi/gH] 15.000 10.000 5.000 7d 14d 56d 63d 21d 28d 35d 42d 49d 0 0 168 336 504 672 840 1008 1176 1344 1512 Hours HTO Exposure
The Method of Graphical Analysis Biological formation and mono-molecular kinetics start exponential according to Biological formation and mono-molecular kinetics start exponential according to F(t) = A*2 **t/ τ and terminate according to F(t) = A*(1 − 2 − (t − t o )/ τ ) = A − C* 2 − t/ τ F(t) = A*2 **t/ τ Both, in biological product formation and in mono-molecular reactions exist a self-accelerating and a self-inhibiting phase A A A OBT = A*(1-2 –(t-to)/ τ ) OBT = A*(1-2 –(t-to)/ τ ) = A – C*2 t/ τ = A – C*2 t/ τ Self- Self- Product accelerating inhibiting phase phase OBT = B*2 t/ τ OBT = B*2 t/ τ Formation Time Formation Time Formation Time
The OBT Data of Tomato Plants During 9 Weeks of HTOExposure 35.000 35.000 35.000 2 OBT Pathways to OBT by H + /T + Exchange 30.000 30.000 30.000 25.000 25.000 25.000 2 inhibiting phases ! Late T + /H + Exch 20.000 OBT [pCi/gH] 20.000 20.000 OBT [pCi/gH] OBT [pCi/gH] Late H + /T + exchange Late H + /T + exchange self- accelerating self- inhibiting 15.000 15.000 15.000 Phase Phase 1 Pathway to CBT by Photosynthesis 10.000 10.000 10.000 Photosynthesis 5.000 5.000 5.000 Early H + /T + exchange Early T + /H + 14d 21d 42d 7d 14d 14d 21d 21d 28d 28d 28d 35d 42d 42d 49d 49d 49d 56d 63d 63d 63d 7d 7d 35d 35d 56d 56d 0 0 0 A look at details of 0 168 336 504 672 840 1008 1176 1344 1512 0 0 168 168 336 336 504 504 672 672 840 840 1008 1176 1344 1512 1008 1176 1344 1512 Hours HTO Exposure Hours HTO Exposure Hours HTO Exposure 700 h growth
10.000 10.000 10.000 9.000 9.000 9.000 8.000 8.000 8.000 Dark phases during photosynthesis 7.000 7.000 7.000 Photosynthesis 6.000 6.000 6.000 inhibiting OBT[pCi/gH] OBT[pCi/gH] OBT[pCi/gH] phase 5.000 5.000 5.000 Late H + /T + 4.000 4.000 4.000 Early H + /T + 3.000 3.000 3.000 2.000 2.000 2.000 Photosynthesis accelerating phase 1.000 1.000 1.000 by approximation 21d 21d 7d 7d 7d 14d 14d 14d 21d 28d 28d 28d 0 0 0 A look at details of 0 0 168 168 336 336 504 504 672 672 0 168 336 504 672 Hours HTO Exposure Hours HTO Exposure Hours HTO Exposure 24 h growth
10.000 10.000 10.000 10.000 10.000 10.000 10.000 10.000 9.000 9.000 9.000 9.000 9.000 9.000 9.000 9.000 8.000 8.000 8.000 8.000 8.000 8.000 8.000 8.000 There is no OBT formation by photosynthesis at night. 7.000 7.000 7.000 7.000 7.000 7.000 7.000 7.000 But there is OBT formation 6.000 6.000 6.000 6.000 6.000 6.000 6.000 6.000 TFWT [pCi/mL] TFWT [pCi/mL] TFWT [pCi/mL] TFWT [pCi/mL] OBT[pCi/gH] OBT[pCi/gH] OBT[pCi/gH] OBT[pCi/gH] at night by fast H + /T + exchange 5.000 5.000 5.000 5.000 5.000 5.000 5.000 5.000 4.000 4.000 4.000 4.000 4.000 4.000 4.000 4.000 Fast T + /H + 3.000 3.000 3.000 3.000 3.000 3.000 3.000 3.000 2.000 2.000 2.000 2.000 2.000 2.000 2.000 2.000 Accelerating Accelerating Photosynthetic Photosynthetic 1.000 1.000 1.000 1.000 1.000 1.000 1.000 1.000 Phase Phase 1d 1d 0 0 0 0 0 0 0 0 0 0 0 0 24 24 24 24 Hours HTO Exposure Hours HTO Exposure Hours HTO Exposure Hours HTO Exposure
Thank You for Your Attention
Photosynthetic photon flux density: 500 → 430 mE/s/m 2 Steady ‐ state atmospheric HTO: 95080 ± 11280 pCi/gH 6 Plants (14 ‐ 16 weeks old) Lower = Old Foliage → abrupt exposure Upper = New Foliage → chronic exposure
10.000 10.000 9.000 9.000 8.000 OBT formation during 7 days 8.000 7.000 7.000 6.000 6.000 OBT[pCi/gH] OBT[pCi/gH] 5.000 5.000 4.000 4.000 Early T + /H + 3.000 3.000 During accelererating Accelerating Photosynthesis 2.000 2.000 Photo-syn- OBTformation is inferior thetic phase 1.000 1.000 to fast H + /T + 3d 3d 1d 2d 5d 6d 7d 1d 2d 5d 6d 7d 4d 4d 0 0 0 24 48 72 96 120 144 168 0 24 48 72 96 120 144 168 Hours HTO Exposure Hours HTO Exposure A look at details of 1 day growth
Recommend
More recommend