Objectives Review Key Metrics related to Endovascular Therapy in - - PDF document

objectives
SMART_READER_LITE
LIVE PREVIEW

Objectives Review Key Metrics related to Endovascular Therapy in - - PDF document

2/27/2020 From Scene to Suite: Central South Regional Stroke Paramedic Stroke Workshop Stroke Endovascular Therapy Outcomes Rhonda Whiteman and Stefan Pagliuso March 4, 2020 Objectives Review Key Metrics related to Endovascular Therapy in


slide-1
SLIDE 1

2/27/2020 1

From Scene to Suite: Central South Regional Stroke Paramedic Stroke Workshop Stroke Endovascular Therapy Outcomes

Rhonda Whiteman and Stefan Pagliuso March 4, 2020

Objectives

  • Review Key Metrics related to Endovascular

Therapy in Central South Ontario

  • Volumes
  • Treated/Not Treated
  • Patient Characteristics
  • Outcomes

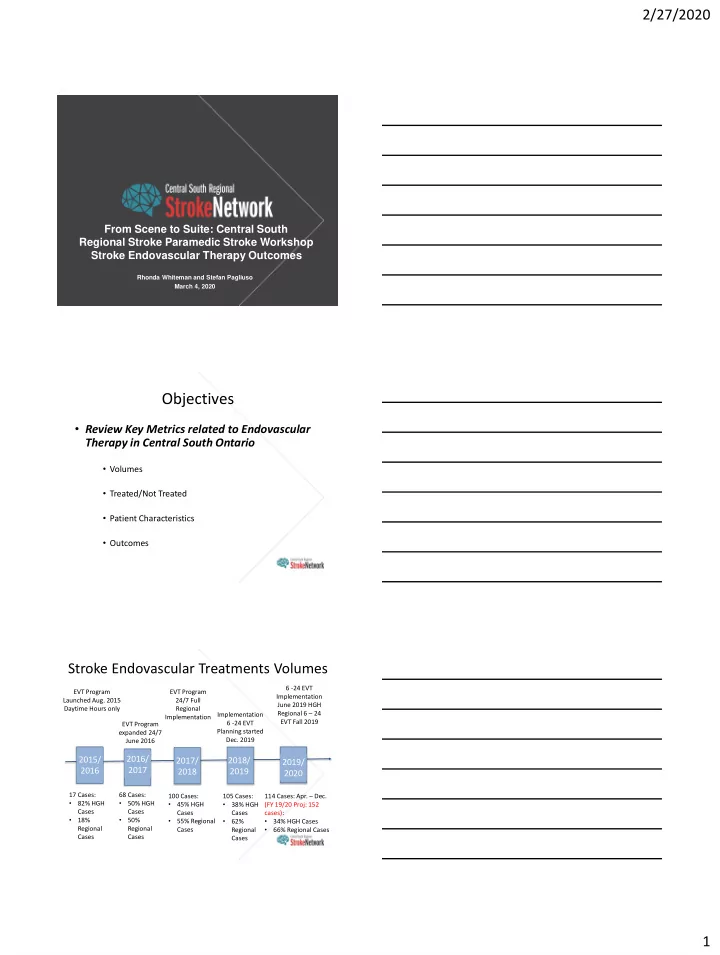
Stroke Endovascular Treatments Volumes

2015/ 2016 2016/ 2017 2017/ 2018 2018/ 2019 2019/ 2020

EVT Program Launched Aug. 2015 Daytime Hours only 17 Cases:

  • 82% HGH

Cases

  • 18%

Regional Cases EVT Program expanded 24/7 June 2016 68 Cases:

  • 50% HGH

Cases

  • 50%

Regional Cases 100 Cases:

  • 45% HGH

Cases

  • 55% Regional

Cases 105 Cases:

  • 38% HGH

Cases

  • 62%

Regional Cases 114 Cases: Apr. – Dec. (FY 19/20 Proj: 152 cases):

  • 34% HGH Cases
  • 66% Regional Cases

EVT Program 24/7 Full Regional Implementation Implementation 6 -24 EVT Planning started

  • Dec. 2019

6 -24 EVT Implementation June 2019 HGH Regional 6 – 24 EVT Fall 2019

slide-2
SLIDE 2

2/27/2020 2

4.7% 3.5% 4.0% 2.7% 7.4%

Central South Regional Stroke Network Regional Transferred Cases N=98 Cases

15 cases transferred 60% Treated 20 Cases Transferred 75% Treated 20 cases Transferred 90% Treated

24 Cases Transferred 79% Treated

18 cases Transferred 83% Treated

Reasons Regional Stroke Cases not Treated FY 2019/20 YTD Q3 N=23

30% 35% 4% 9% 20%

ASPECTS DECAY - Extension of Stroke Clinical Improvement/ Vessel Recanalization Intracerebral Hemorrhage Clot Distally Other

slide-3
SLIDE 3

2/27/2020 3

Who are we Treating?

  • Age

– Average: 71 – Median: 75 – Range: 29 - 99

  • Site of Occlusion

– M1 (56%) – Carotid T (25%) – Other (19%)

Who are we Treating?

  • Percentage treated with tPA

– 47.4%

  • Stable vs. Unstable Cases

– Stable: 90.4% – Unstable: 9.6%

Functional Outcomes

  • Patient Presentation

– Median Admit NIHSS Score: 18

slide-4
SLIDE 4

2/27/2020 4

Functional Outcomes

  • Patient Presentation

– Median Discharge NIHSS Score: 4

Functional Outcomes

  • Length of Stay

– Median Acute LOS: 3 days

  • Discharge Disposition

– Directly Home: 19% – Acute Repat: 48% – R,ehabilitation: 18% – Deceased/Hospice: 14%

slide-5
SLIDE 5

2/27/2020 5

Questions

mcnicolr@hhsc.ca pagliuso@hhsc.ca