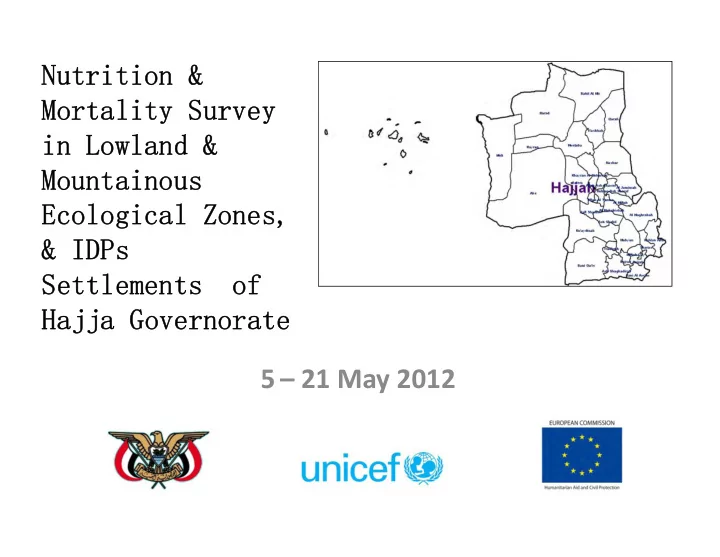

Nutrition & Mortality Survey in Lowland & Mountainous Ecological Zones, & IDPs Settlements of Hajja Governorate 5 – 21 May 2012
Overall objective To establish accurately the nutrition situation in two ecological zones of Hajja Governorate and IDPs settlements, determine some of the factors influencing malnutrition and identify the accessibility to health services
Specific objectives • To estimate the level of acute malnutrition (wasting), stunting and underweight among children aged 6-59 months in the Lowland and Mountainous Ecological Zones of Hajja Governorate as well as in IDPs settlements within the governorate • To identify factors influencing nutrition status of the children in the survey areas including disease prevalence and access to essential services. • To estimate the prevalence of some common diseases (measles, diarrhoea, fever and ARI) in the survey areas. • To estimate the measles and polio vaccination and Vitamin A supplementation coverage among children in the survey areas. • To estimate the crude and under-five mortality rates in the survey areas.
Sample size and design Parameters Lowland Mountains IDPs Estimated Acute Malnutrition 31.4 17 31.4 Prevalence (%) Desired Precision (%) 5 5 5 Design Effect 2 2 2 Average Household Size 6.9 7 7 Under 5 year old (%) 22 21 20 3 Non response household (%) 3 3 Sample Size (N) 544 368 590 Households surveyed 607 439 623 Children surveyed 787 583 850
Quality concern • Small number of teams with focus training. • Standardization of measurers. • Field test before conduct the data collection. • Intensive supervision at field. • Daily check for the quality. • Data entry verification
Plausibility check – Lowland
Plausibility check – Mountains
Plausibility check – IDPs
Findings Household characteristics
Household size Lowland Mountains IDPs N % N % N % Total Households 607 100 439 100 623 100 Household size 7.8 8.4 7.45 (Mean): Mean No of 1.4 1.5 Underfives Boys (%): 397 (49.6%) 288 (49.5%) 388 (46.5%) Girls (%): 390 (50.4%) 294 (50.5%) 446 (53.5%)
Household head gender
Household caretaker education
Household main income source
Household main drinking water source
Household drinking water containers cleanness
Latrine type
Where health service sought
Findings Children aged 6 – 59 months
Acute Malnutrition (Wasting)
Acute Malnutrition (Wasting) Lowlands Mountains IDPs
Acute Malnutrition- Case load
Underweight
Underweight Lowlands Mountains IDPs
Chronic malnutrition (Stunting)
Chronic malnutrition (Stunting) Lowlands Mountains IDPs
Compare with other surveys
Feeding practices
Vaccination and vitamin A supplementation
Morbidity
Sleep under mosquito net
Findings Mortality
Crude and underfive death rates Lowland Mountains IDPs Underfive 0.63 0.60 0.33 crude 0.22 0.25 0.13 Per 10000 per day
Pyramids Lowlands Mountains IDPs
Thanks
Recommend
More recommend