Presentation outline slipping mortality in purse seine fisheries - - PDF document

presentation outline
SMART_READER_LITE
LIVE PREVIEW

Presentation outline slipping mortality in purse seine fisheries - - PDF document

14.07.2014 Quantification and mitigation of Presentation outline slipping mortality in purse seine fisheries Part 1: Mortality of crowded and slipped herring and mackerel Part 2: Mortality causes of slipped herring Part 3: Slipping mortality


slide-1
SLIDE 1

14.07.2014 1

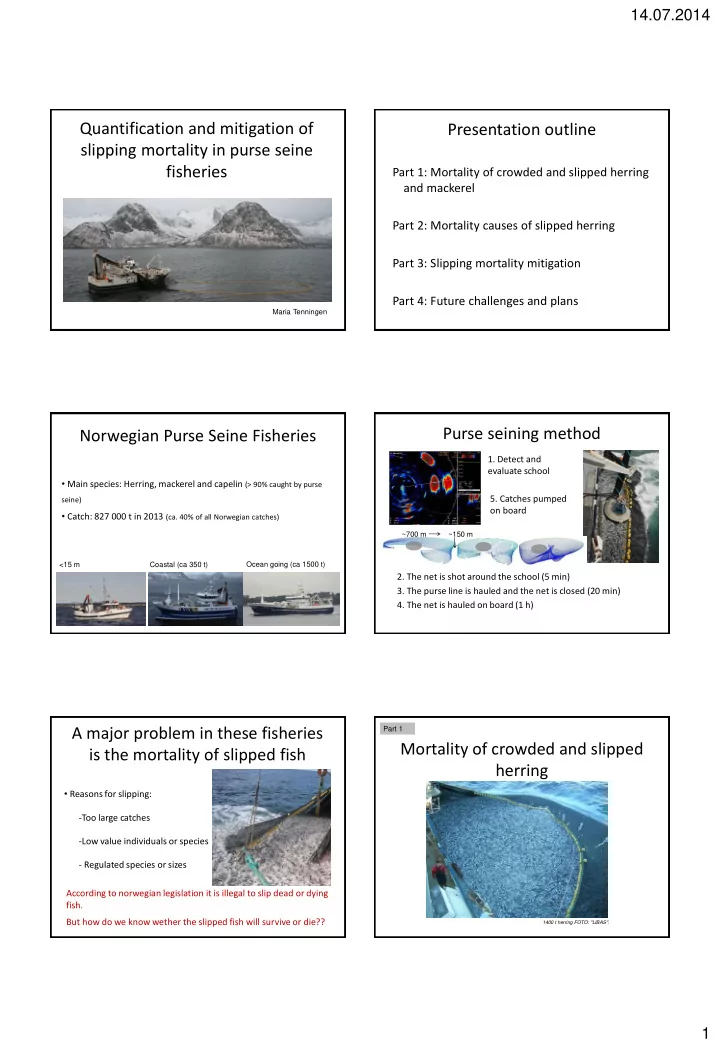
Quantification and mitigation of slipping mortality in purse seine fisheries

Maria Tenningen

Presentation outline

Part 1: Mortality of crowded and slipped herring and mackerel Part 2: Mortality causes of slipped herring Part 3: Slipping mortality mitigation Part 4: Future challenges and plans

Norwegian Purse Seine Fisheries

Ocean going (ca 1500 t) Coastal (ca 350 t) <15 m

  • Main species: Herring, mackerel and capelin (> 90% caught by purse

seine)

  • Catch: 827 000 t in 2013 (ca. 40% of all Norwegian catches)

Purse seining method

  • 2. The net is shot around the school (5 min)
  • 3. The purse line is hauled and the net is closed (20 min)
  • 4. The net is hauled on board (1 h)
  • 1. Detect and

evaluate school

  • 5. Catches pumped
  • n board

~700 m ~150 m

A major problem in these fisheries is the mortality of slipped fish

  • Reasons for slipping:
  • Too large catches
  • Low value individuals or species
  • Regulated species or sizes

According to norwegian legislation it is illegal to slip dead or dying fish. But how do we know wether the slipped fish will survive or die??

Mortality of crowded and slipped herring

1400 t herring FOTO: "LIBAS".

Part 1

slide-2
SLIDE 2

14.07.2014 2

Crowding experiments

(North Sea herring, June 2008 and 2009)

Huse and Vold, 2010

Method

10 min crowding phase 4-5 days monitoring phase 3 net pens (2 crowded, 1 control)

Mortality of crowded NS herring

10 20 30 40 50 60 100 200 300 400 500 600

Mortality (%) Crowding density (kg m-3)

2008 Round 1 2008 Round 2 2009 Round 1

Controls: careful slipping is ok!

4-5 days post crowding Small individuals are more sensitive

North Sea and Norwegian Spring Spawning (NSS) Herring

10 20 30 40 50 60 100 200 300 400 500 600

Mortality (%) Crowding density (kg m-3)

North Sea NSS 2011 NSS 2012 Round 1 NSS 2012 Round 2 NSS herring: unpublished data IMR

Herring and Mackerel

Density & Time

Small scale: Lockwood et al., 1983 Large scale: Huse and Vold, 2010

  • 10

10 20 30 40 50 60 70 80 90 100 200 300 400 500 600

Mortality (%) Crowding density (kg m-3)

Herring Mackerel (small scale) Mackerel (large scale)

Mortality causes

Part 2

Lack of

  • xygen?

Physical exhaustion? Skin injuries ?

slide-3
SLIDE 3

14.07.2014 3

Initial stress response:

  • Increasing cortisol
  • Increasing lactate
  • Increased chloride

Extended stress response:

  • Continuously high cortisol levels
  • Loss of osmoregulatory balance
  • Approaching energy exhaustion

Physiological stress response to crowding

Laboratory experiments where 25 and 50% of herring scales were removed. Mortality monitored for 7 days

The role of scale loss

How much scales do herring lose during commercial fishing?

(Svalheim, 2012)

92 kg m-3 – mortality 10% 226 kg m-3 – mortality 28% 393 kg m-3 – mortality 36%

The role of hypoxia

403 kg m-3, 52% mortality 478 kg m-3, 51% mortality

Herring have been shown to tolerate oxygen levels to < 30%

(Dommasnes et al., 1994; Domenici et al., 2000)

  • Scale loss is likely to explain some crowding mortality, but not

all!

  • Hypoxia and physical exhaustion are likely to be important

additional stressors

  • Mortality is a result of a combination of several ”stressors”
  • The main causes of mortality may vary under different

conditions

  • Understanding the mortality causes is important!

– It can help us understand variation in mortality (within an experiment, between experiments and between species) – Identify the best mitigation measures

Conclusions on mortality causes

Slipping mortality mitigation

Part 3

slide-4
SLIDE 4

14.07.2014 4

Alternative 1 Quantify mortality and include the data in the assessment Alternative 2 Total ban on slipping  not feasible in practice (increased net bursts, increased illegal slipping ) Alternative 3 Reduce the need for slipping  improved pre-catch identification (development of sonar technology) Alternative 4 Increase the survival of slipped fish  Careful slipping before densities get too high

How late in a haul can slipping be accepted?

10 20 30 40 50 60 70 80 90 100 200 300 400 500 600

Mortality (%) Crowding density (kg m-3)

Herring Mackerel (small scale) Mackerel (large scale)

Slipping limit

How can we estimate fish densities?

Challenges:

  • Large and flexible net and fish may be anywhere
  • Acoustics  cover large area, but airbubble noise from vessel is problematic
  • Camera technology  high resolution but short range, lack of light

Monitoring net volume and fish shoal size during purse seining

Fishery sonar Transponders

Image: Simrad

The reconstructed 3D net and shoal shape. Part (a) shows the 3D point cloud created from the sonar data at several tilt angles. Parts (b-d) show the closed triangulated surface used for the volume estimates at 22, 44 and 50 % hauled net. The shoal is shown in red and the ship in blue.

Results: Net volume

Significant variation in net volume between sets Fitted a regression model to describe net volume as a function

  • f hauling proportion
slide-5
SLIDE 5

14.07.2014 5

Mackerel 30 kg m-3 or 0.01 m3 per fish  5-28% mortality Herring 100 kg m-3 or 0.002 m3 per fish  0-10% mortality 7/8 hauled net is at  87%

Results:

  • a. Net volume available per fish in the catch (Catch biomass / net volume)
  • b. Density (catch biomass / shoal volume)

12 kg Lowest registered value 0.07

How to use the data into regulation?

  • 1. Further develop the methods for net and catch monitoring

(more accurate estimates and also from the last part of hauling)

  • 2. Net volume monitoring: Need to verify the assumption of even

fish distribution at the point where density becomes harmful

  • 3. Need to understand what factors and how these determine net

volume (e.g. net design, vessel operation and environment)  Model net volume under different conditions and use it together with catch size to predict when critical densities can be expected.  Real time monitoring for density or net volume (with a catch biomass estimate) for a flexible limit on slipping.

Expected volume available for individual fish (m3 per fish) as a function of hauling proportion and catch weight, obtained from the linear regression model fitted to the net volume estimates.

Catch simulations

Future work

? Mortality causes Improved gear and catch monitoring ? Slipping quantities Better mortality data for mackerel

Part 4

Catch and gear monitoring during purse seining Funding application 2015-2017

  • Norwegian Research Council 3. September 2014

Title: Development of Tools to Reduce Slipping Mortality in Purse Seine Fishing

Main objective: Reduce slipping mortality in mackerel and herring purse seine fisheries by improving the monitoring and control of the fishing

  • peration
slide-6
SLIDE 6

14.07.2014 6

Purse seine projects at the IMR

 a reduced need for slipping and in situations where slipping is necessary it can be carried out in an early stage of hauling in a careful way

Thank You