Nutrient Rich "Hot Spots" Across the Sierran Front to the - - PowerPoint PPT Presentation

nutrient rich hot spots across the sierran front to the
SMART_READER_LITE
LIVE PREVIEW

Nutrient Rich "Hot Spots" Across the Sierran Front to the - - PowerPoint PPT Presentation

Nutrient Rich "Hot Spots" Across the Sierran Front to the Cascades CABNR TEAM: Carinna Robertson (Graduate Research Assistant, University of Nevada, Reno) Dr. Wally Miller, Dr. Dale Johnson, Dr. Roger Walker , Casandra Woodward and


slide-1
SLIDE 1

Nutrient Rich "Hot Spots" Across the Sierran Front to the Cascades

CABNR TEAM:

Carinna Robertson (Graduate Research Assistant, University of Nevada, Reno)

  • Dr. Wally Miller, Dr. Dale Johnson, Dr. Roger Walker ,

Casandra Woodward and Brooke Eustis
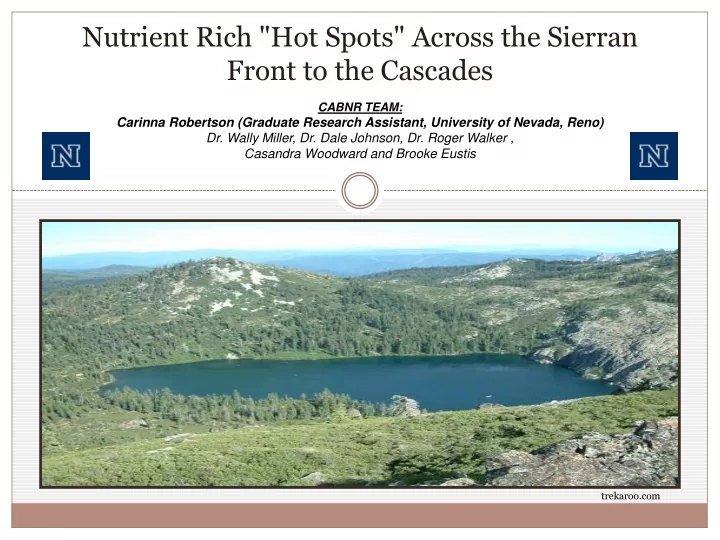
trekaroo.com

slide-2
SLIDE 2

Nutrient Rich "Hot Spots" Across the Sierran Front to the Cascades

 Introduction

 Biogeochemical “hot spots” or “hot moments”

 Transport of Nutrients (Nitrogen (N) and Phosphorus (P)  Calcium (Ca2+), Magnesium (Mg2+), Potassium (K+)

 Past /Current Research

 Biologically available N and P traveling from the O horizon along preferential flow

paths (Miller et al., 2005)

 Identified the periodic presence of nutrient rich “hot spots/moments” within the soil

matrix; albeit the spatio-temporal scale was uncertain (Johnson et al., 2011).

slide-3
SLIDE 3

Nutrient Rich "Hot Spots" Across the Sierran Front to the Cascades  Goal of this Research

 To develop a better understanding of water flow and nutrient

infiltration patterns across the Sierra Nevada Mountain Range.

 Potential Cause of Excess Nutrients  Management Strategies

 Primary Objectives

 Biogeochemical “Hot Spots”

 Presence or absence  Chemical composition  Geographic distribution

slide-4
SLIDE 4

Nutrient Rich "Hot Spots" Across the Sierran Front to the Cascades  Project Design

  • 5 Study Locations:

 Castle Lake, CA  Sagehen, CA  Truckee, CA  Little Valley, NV  Kings River, CA

slide-5
SLIDE 5

Project Design: Controlled Grid Analysis

 Controlled Grid Plots  2-9m2 , 16 points

 Resin Lysimeters  Resin Capsules

 2 Settings:

 Upland Forested Ecotone  Transition/Variable

Down-Gradient Ecotone

Lysimeter /Capsule Grid

3 meters 1 2 3 4 5 6 7 8 9 10 11 13 12 14 15 16 Uphill Capsule

  • r Lysimeter

Point Runoff Collector Runoff Collector

slide-6
SLIDE 6

1st and 2nd Year Capsule Results Moderate and Extreme Outliers

4 8 12 16 20 4 8 12 16 20 Vertical Grid Positions Horizontal Grid Positions

Nutrient "Hot Spot" Detection at the TR Site 1st Yr. (umol/cm2)

Ca Mg Ortho-P NH4-N NO3-N

~ 9 m2 Most Nutrients Would Correlate at a Grid Point

4 8 12 16 20 4 8 12 16 20 Vertical Grid Positions Horizontal Grid Positions

Nutrient "Hot Spot" Detection at TR Site 2nd Yr. (umol/cm2)

Ca Mg Ortho-P NH4-N NO3-N

slide-7
SLIDE 7

Capsule Grid Results Moderate and Extreme Outliers

~ 256 Grid Points only 4 Points Detected Similar High Nutrient Fluxes (1.5%)

4 8 12 16 20 4 8 12 16 20 Vertical Grid Positions Horizontal Grid Positions

Nutrient "Hot Spot" Detection at the LVJP Site 1st Yr. (umol/cm2)

Ca Mg NH4-N NO3-N Ortho-P 4 8 12 16 20 4 8 12 16 20 Vertical Grid Positions Horizontal Grid Positions

Nutrient" Hot Spot" Detection at the LVJP Site 2nd Yr. (umol/cm2)

Ca Mg Ortho-P NH4-N NO3-N

slide-8
SLIDE 8

4 8 12 16 20 4 8 12 16 20 Vertical Grid Positions Horizontal Grid Positions

Nutrient "Hot Spot" Detection at the SL Site 1st Yr. (umol/cm2)

Ca Mg Ortho-P NO3-N NH4-N 4 8 12 16 20 4 8 12 16 20 Vertical Grid Positions Horizontal Grid positions

Nutrient "Hot Spot" Detection at the SL Site 2nd Yr. (umol/cm2)

Ca Mg Ortho-P NH4-N NO3-N

Capsule Grid Results Moderate and Extreme Outliers

slide-9
SLIDE 9

Capsule Grid Results Moderate and Extreme Outliers

4 8 12 16 20 4 8 12 16 20 Vertical Grid Position Horizontal Grid Position

Nutrient "Hot Spot" Detection at CL Site 1st yr. (umol/cm2)

Ca NO3-N Mg NH4-N Ortho-P 4 8 12 16 20 4 8 12 16 20 Vertical Grid Positions Horizontal Grid Positions

Nutrient" Hot spot" Detection at CL Site 2nd Yr. (umol/cm2)

Ca Mg NO3-N NH4-N Ortho-P

slide-10
SLIDE 10

0m 1m 2m 3m 0m 1m 2m 3m

NH4-N (umol/cm2) Fall Collection 2009

0m 1m 2m 3m 0m 1m 2m 3m

NH4-N (umol/cm2) Spring Collection 2010

Truckee Capsule Grids

Fall , NH4-N Spring, NH4-N (umol/cm2) (umol/cm2)

  • Conc. NH4-N (ug/cm2)
slide-11
SLIDE 11

Capsule Grid Fall Analysis

5 10 15 20 25 1 3 5 7 9 11 13 15 17 19 21 23 25 27 29 31

Sagehen Upland Site

1st Yr. NO3-N ug/cm2 2nd Yr. NO3-N ug/cm2

Sagehen Upland Site Moderate and Extreme Outlier

ug/cm2

slide-12
SLIDE 12

Nutrient Trends Across Sites

  • rtho-P

. 1st Yr. 2nd Yr. umol/cm2

slide-13
SLIDE 13

NO3-N NH4-N

. 1st Yr. 2nd Yr.

umol/cm2 umol/cm2

slide-14
SLIDE 14

Ca2+ Mg2+ . 1st Yr. 2nd Yr. umol/cm2 umol/cm2

slide-15
SLIDE 15

Conclusions

 Biogeochemical “Hot Spots/Moments” are Variable

 Spatial Variation  Seasonal and Annual Variation

 9 m2 all Nutrients will Possibly Correlate at a Single Grid  Water Flow and Nutrient Infiltration Patterns were

Extremely Variable

 Geographic Distribution

slide-16
SLIDE 16

Questions

http:www.sierranevadaphoto123rf.com