
SLIDE 1
- Oysters (Kerstin)
- Ecotone (Kerstin)
- Marsh (Rikke & Charlie)
- Hypoxia (John & Rikke)
- Eucalyptus (Susie)
Current research highlights ESNERR Research Oysters (Kerstin) - - PowerPoint PPT Presentation
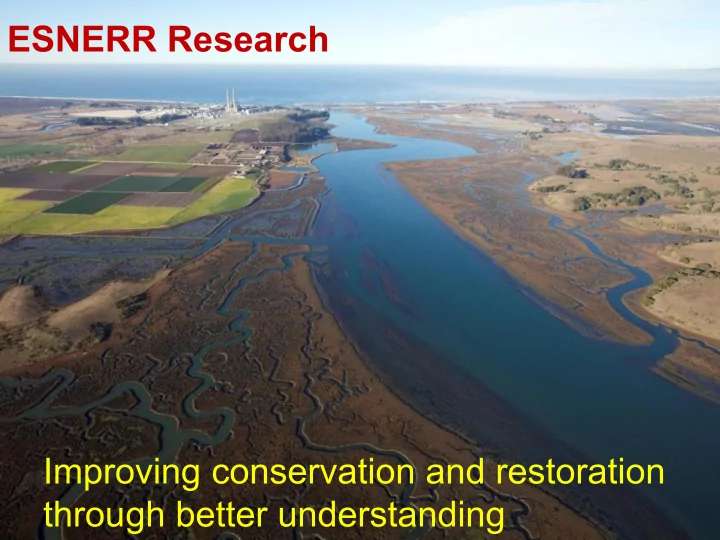
Current research highlights ESNERR Research Oysters (Kerstin) Ecotone (Kerstin) Marsh (Rikke & Charlie) Hypoxia (John & Rikke) Eucalyptus (Susie) Improving conservation and restoration through better understanding
WATER QUALITY MONITORING AND TRENDS
ESNERR water quality monitoring
Spatial program since monthly 1989 (24 sites) Temporal program every 15 mins since 1995 (4 sites)
WQ report card
was tri-fold had out now interactive on website
Recent summary of Spatial program 30 yr long term trends study
ESNERR WQ MONITORING PROGRAMS
Volunteer Program Great spatial coverage (24
stations)
Monthly sampling Very long time series (since
1989)
Physical Parameters and
nutrients
ESNERR WQ MONITORING PROGRAMS
Volunteer Program Great spatial coverage (24
stations)
Monthly sampling Very long time series (since
1989)
Physical Parameters and
nutrients
NERR Program Great temporal coverage
(every 15 min!)
4 stations Since 1995
AP VM SM NM
NERR SYSTEM-WIDE MONITORING PROGRAM
WQ DATA COLLECTED CONSISTENTLY AT FOUR STATIONS AT 28 NERR SITES
WATER QUALITY INDEX GRADING SYSTEM
Canadian Water Quality Index (WQI)
Created by the Canadian
Council of Ministers of the Environment in 2001
Widely used: peer-review
journals, UN, Bay Institute, Ventura County, CCAMP
ALL COMES DOWN TO THRESHOLDS
Parameter Threshold Ammonia 0.1 mg/L Ammonia (Unionized) 0.025 mg/L Algal Cover 20% Chlorophyll a 15 µg/L Nitrate as N 1.0 mg/L Orthophosphate as P 0.13 mg/L Turbidity 25 NTU Dissolved Oxygen 7 to 13 mg/L pH 7 to 8.5
GRADING SCALE
Index Value Condition Grade Description 95 – 100 Excellent A No virtual threat or impairment. Water quality conditions very close to natural or pristine levels. 80 – 94 Good B Only minor degree of threat or impairment. Water quality conditions rarely depart form natural or desirable levels. 65 – 79 Fair C Occasionally threatened or impaired. Water quality conditions sometimes depart form natural or desirable levels. 45 – 64 Marginal D Frequently threatened or impaired. Water quality conditions
0 – 44 Poor F Almost always threatened or impaired. Water quality conditions usually depart from natural or desirable levels.
2013 RESULTS
1 Carneros Creek* 34 F 2 Blohm Porter Marsh* 43 F 3 Hudson Landing 51 D 4 Azevedo Pond, North* 74 C 5 Azevedo Pond, Central* 46 D 6 Azevedo Pond, South* 43 F 7 Kirby Park 67 C 8 Reserve North Marsh* 67 C 9 Strawberry Rd* 22 F 10 Whistlestop Lagoon* 73 C 11 South Marsh 80 B 12 Vierra 80 B 13 Skipper's Landing 72 C 14 Bennett Slough West* 66 C 15 Bennett Slough East* 50 D 16 Struve Pond* 43 F 17 Moss Landing Road, North 44 F 18 Moss Landing Road, South* 27 F 19 Moro Cojo Slough* 32 F 20 Potrero Road, North 34 F 21 Potrero Road, South* 30 F 22 Monterey Dunes Way* 36 F 23 Tembladero Slough* 21 F 24 Salinas River Bridge 37 F Upper Elkhorn Slough Lower Elkhorn Slough Bennett Slough Southern Estuary * Site behind water control structure
FINAL PRODUCT
Includes a summary of:
Elkhorn Slough ecological
importance
Water quality monitoring program Grading system Results Ways to improve water quality
NOW THE FINAL PRODUCT IS ON THE WEB!
Our new display in the Visitor Center Coming Soon!
report card and do their
investigate areas, parameters or years of interest
module to learn about water quality and do their
some areas get better scores than others
30 TRENDS STUDY OF SPATIAL PROGRAM
HIGHLIGHTS OF THE STUDY
· Variability was not generally correlated to weather or
effects on wetland water quality
· Water quality remains highly impaired at many sites, especially
those with artificial tidal restriction resulting in increased residence times
LOCAL RESTORATION IMPROVES WATER QUALITY
The significant improvements
documented in regions with high conservation and restoration investments provide hope for the future, and illustrate that, despite the potential for slow response times due to legacy effects from nutrient enrichment, water quality can be improved relatively quickly when resources are appropriately directed
· Overall water
quality is improving with significant improvements in water quality over time outnumbering significant deterioration in water quality, for 25 sites and three nutrient water quality parameters
The Middle and Upper
regions of Elkhorn Slough highest frequency of water quality improvements, while the Lower region of Elkhorn Slough, highest frequency of water quality deterioration
Ammonia Nitrate Phosphate Numeric Grade Letter Grade 1
r
+
30.1 F 2
r
ns ns
F 3 ns
D 4
r
D 5
r
F 6
r
30.4 F 7
C 8
r
+++ ++ ns 70 C 9
r
ns
23.4 F 10
C 11
C 16
r
F 15
r
D 14
r
ns ns ns 25
r
++ ns
C 12 + ++
C 13 ++ ns
C 19
r
ns ns ++ 35 F 18
r
++ ns + 37.3 F 17 ns +++ ns 57.5 D 24
r
ns ns +++ 30.2 F 23
r
F 22
r
ns 27.2 F 21
r
ns 32.1 F 20 ns +++ + 34.9 F South Estuary Upper Slough Azevedo Middle Slough Bennett Slough Lower Slough Moro Cojo Slough