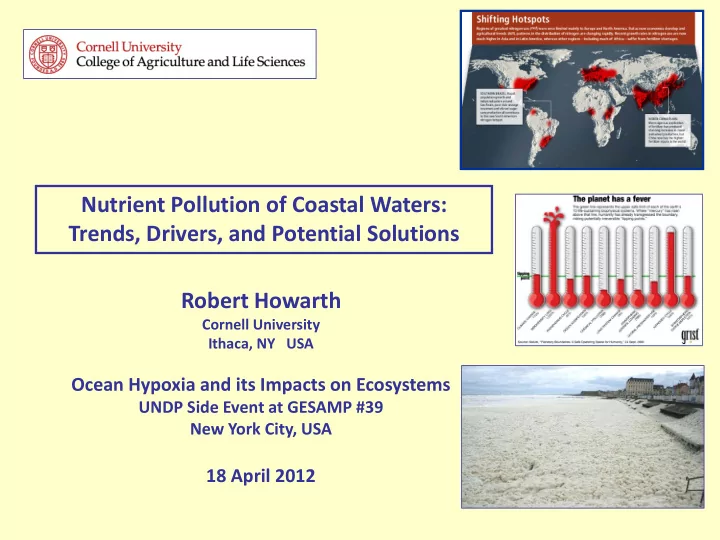
SLIDE 1 Robert Howarth
Cornell University Ithaca, NY USA
Ocean Hypoxia and its Impacts on Ecosystems
UNDP Side Event at GESAMP #39 New York City, USA
18 April 2012
Nutrient Pollution of Coastal Waters: Trends, Drivers, and Potential Solutions
SLIDE 2 (Rockstrom et al. 2009)
Global status of earth’s 10 life-sustaining biophysical systems
nitrogen
SLIDE 3
Nitrogen (and not phosphorus) is the primary culprit for coastal eutrophication and hypoxia
(although controlling both is best policy)
SLIDE 4
+ nitrogen + phosphorus + nitrogen & phosphorus No nutrients added Oviatt et al. 1996
SLIDE 5 Seine and Scheldt Basins and Belgian coast of North Sea
North Sea English Channel
SLIDE 6 200 400 600 800 1970 1980 1990 2000 2010 annual mean discharge, m3/s 500 1000 1500 2000 2500 3000 1970 1980 1990 2000 2010 TN flux, kgN/km²/yr 50 100 150 200 250 300 1975 1980 1985 1990 1995 2000 2005 2010 TP flux, kgP/km²/yr
Seine River basin
Freshwater discharge TN load TP load
SLIDE 7 10 20 30 1970 1980 1990 2000 2010 max Chla, mg/m3
Chlorophyll in North Sea on Belgian coast
500 1000 1500 2000 2500 3000 1970 1980 1990 2000 2010 TN flux, kgN/km²/yr
Seine River N load
1000 2000 3000 4000 1970 1980 1990 2000 2010 TN flux, kgN/km²/yr
Scheldt River N load
SLIDE 8
50 100 150 200 1900 1920 1940 1960 1980 2000
Teragrams of nitrogen Natural N fixation on the continents
Total human inputs Fertilizer N fixation in agro-ecosystems Fossil fuel burning
Global trends in nitrogen use per year
(modified from Howarth et al. 2005)
SLIDE 9
Regional scale perspective important for nutrients. Changes are driven by global energy and agricultural policies. But with exception of N2O, nutrient cycles are altered at local to regional scales, not global scales, and effects are manifested at these local to regional scales.
SLIDE 10
New York Times (4/30/08) Townsend & Howarth 2010
SLIDE 11 500 1000 1500 2000 1 2 3 4 5 6 7 8 9 Series1
Republic of Korea North Sea watersheds Northeastern U.S. Yellow River basin Mississippi River basin Baltic Sea watersheds
Southwestern Europe Labrador and Hudson’s Bay Natural background flux
Flux of nitrogen from the landscape to coastal oceans in rivers for contrasting regions of the world in the temperate zone (kg per km2 of watershed area per year; from Howarth et al. 2005).
SLIDE 12 Kg N km-2 year-1
North Atlantic Ocean
International SCOPE N Project (Howarth et al. 1996)
NANI
(net anthropogenic N inputs)
SLIDE 13 (Howarth et al. 2012) ~ 150 watersheds
~ 25% of NANI exported to coastal
- ceans on average from 150
watersheds in Europe and the US
SLIDE 14 Swaney et al. 2012
Chinese watersheds
SLIDE 15
(Hong et al. 2011)
SLIDE 16 NOy deposition Fertilizer Ag N fixation Net food & feed
NANI
Hong et al., 2012
SLIDE 17 Region Nutrient fertilizer consumption (kg N/capita, 2009) NOx Emission (kg N/capita, 2000) N fixation and net flux of N in food and feeds Sum of Reactive Nitrogen (kg N per capita) Consumption relative to safe
boundary Africa 2.5 0.9 ? 3.4 0.7 South America 12.2 1.2 ? 13.4 2.6 Southeast Asia 12.7 0.7 ? 13.4 2.6 India 13.0 0.5 ? 13.5 2.6 North America 35.9 9.6 ? 45.5 8.9 Europe 18.4 3.1 ? 21.5 4.2 East Asia 24.3 1.2 ? 25.4 5.0 Australia 30.8 7.9 ? 38.8 7.6 Other 10.5 0.6 ? 11.0 2.2
Global 15.4 1.5 4.6 21.5 4.2
Per capita NANI by region (partial analysis)
UNEP Sustainable Resource Use Panel (2011 draft)
SLIDE 18 Technical solutions for nitrogen pollution:
- Agricultural fields: reduce fertilizer amount and
timing; change cropping systems; plant winter cover crops; control drainage seasonally
- CAFOs: treat wastes as society does for human waste
- Vehicle exhaust: tighten emission standards;
encourage hybrid vehicles and electric vehicles
- Power plants: tighten emission standards; encourage
renewable electricity (solar, wind)
- Sewage treatment: require denitrification treatment
Howarth et al. (2005) Millennium Ecosystem Assessment
SLIDE 19
But also think about policy solutions, particularly regarding diet and biofuels….
SLIDE 20 Fie ield ld Lev evel
Leac eached ed t to wat ater er Harvested i d in n crops
3.6 10. 10.5 0.2 (4. 4.2) 2) (1. 1.2) 2) 1.3 5.9 (3. 3.1) 1)
Animal Cons
umpt ption
Leac eached ed t to wat ater er? Denit itrif ifie ied? NH NH3
1.9
Denit itrif ifie ied? Bui uildi ding up i ng up in s n soi
NH NH3 La Landf ndfilled? d? Leac eached ed? La Landf ndfilled? d? Denit itrif ifie ied?
(0. 0.8) 8)
1.4
Was astew ewat ater er & Denit itrif ifie ied
Hum uman n Cons
umpt ption
0.9
Expor ported f d from
2.1 18. 18.5
(Howarth et al. 2002)
Farm nitrogen balance for US (~1995; Tg per year for entire US)
SLIDE 21 If everyone in the US ate this: Instead of this:
The country would use only 1/3rd as much fertilizer, and would have much less nitrogen pollution!
0.0 2.0 4.0 6.0 8.0 10.0 12.0 14.0 16.0 18.0 20.0 1960 1970 1980 1990 2000 2010 2020 2030 fertilizer use, TgN yr
increasing grain exports, standard US diet constant grain exports, standard US diet constant grain exports, Swedish diet constant grain exports, Mediterranean diet
(Howarth et al. 2002)
SLIDE 22 Howarth et al. 2009
Globa
Produc
Liqui quid B d Biof
uels:
200 400 600 800 1000 1200
1975 1979 1983 1987 1991 1995 1999 2003 2007 Year Peta Joules
Ethanol Biodiesel Equiv.
15 billion liters
Biofuels
SLIDE 23 2009: National goal to reduce nitrogen pollution down Mississippi River by 45% to limit size
Several models indicate national ethanol policy will make this difficult or impossible, and instead nitrogen pollution likely to increase…. 30% to 40%
- r more (Donner and Kucarik
2008; Simpson et al. 2008, 2009; EPA 2009; Costello et al. 2010)
SLIDE 24
2.0 1.0 Predicted Nitrogen Load from Mississippi River basin to meet US Ethanol Targets Million tons nitrogen per year 2015 targets 2022 targets (Costello et al. 2010) National target to reduce area of Dead Zone
SLIDE 25
CONCLUSIONS:
Nitrogen is the primary culprit. Nitrogen pollution is growing globally, with agriculture as the primary driver. Technical solutions exist, and can help, often at little cost. But policy considerations of diet (meat!) and energy (liquid biofuels!) are critical.
SLIDE 26 Thanks for invitation to participate!
Coastal Hypoxia Research Program Agriculture, Energy & Environment Program at Cornell University
Thanks for many collaborators, especially:
- Dennis Swaney
- Bongghi Hong
- Roxanne Marino
- Christine Costello
- Gilles Billen
- Josette Garnier
- Christoph Humborg
- Alan Townsend