Nursing Degrees Awarded Nursing Degrees Awarded Louisiana State - - PDF document

nursing degrees awarded nursing degrees awarded
SMART_READER_LITE
LIVE PREVIEW

Nursing Degrees Awarded Nursing Degrees Awarded Louisiana State - - PDF document

4/24/2007 Nursing Degrees Awarded Nursing Degrees Awarded Louisiana State University Louisiana State University Bachelor of Science in Nursing Bachelor of Science in Nursing Health Sciences Center Health Sciences Center Master of


slide-1
SLIDE 1

4/24/2007 1

Louisiana State University Louisiana State University Health Sciences Center Health Sciences Center School of Nursing School of Nursing

Larry H. Hollier, LSUHSC Chancellor Larry H. Hollier, LSUHSC Chancellor Demetrius J. Porche, LSUHSC Demetrius J. Porche, LSUHSC School of Nursing, Acting Dean School of Nursing, Acting Dean

Nursing Degrees Awarded Nursing Degrees Awarded

  • Bachelor of Science in Nursing

Bachelor of Science in Nursing

  • Master of Nursing

Master of Nursing

  • Doctor of Nursing Science

Doctor of Nursing Science

  • Doctor of Nursing Science

Doctor of Nursing Science

Bachelor of Science in Nursing (BSN) Bachelor of Science in Nursing (BSN) Program Program

  • Traditional student (4 year program)

Traditional student (4 year program)

  • CARE (second degree student, 20 months)

CARE (second degree student, 20 months)

  • RN to BSN

RN to BSN

  • RN to BSN

RN to BSN

  • RN to MN

RN to MN

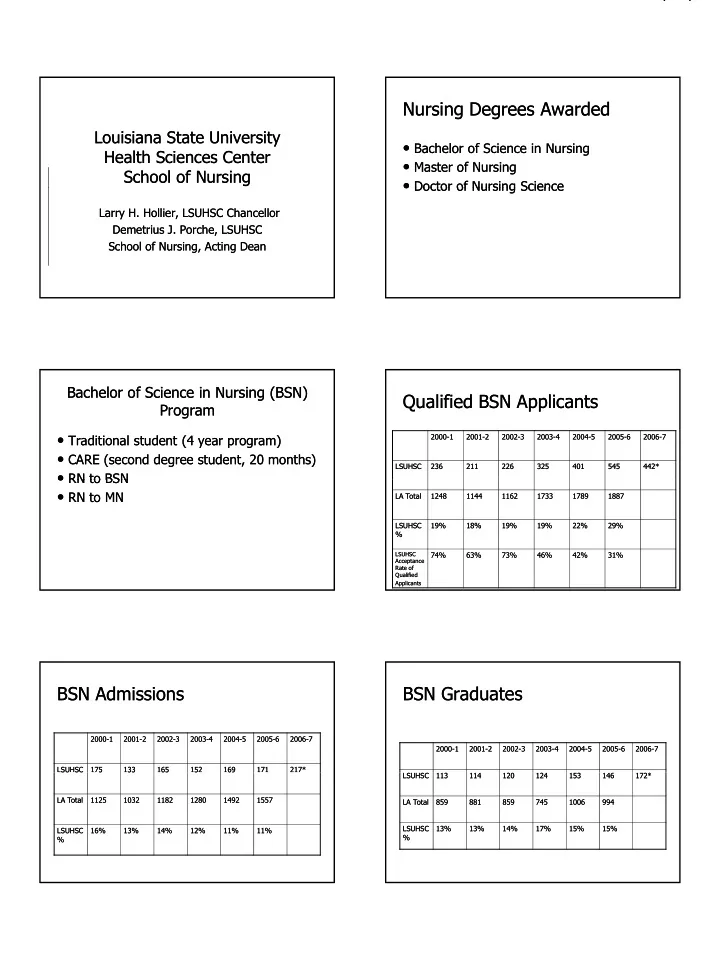
Qualified BSN Applicants Qualified BSN Applicants

2000 2000-

  • 1

1 2001 2001-

  • 2

2 2002 2002-

  • 3

3 2003 2003-

  • 4

4 2004 2004-

  • 5

5 2005 2005-

  • 6

6 2006 2006-

  • 7

7 LSUHSC LSUHSC 236 236 211 211 226 226 325 325 401 401 545 545 442* 442* LA Total LA Total 1248 1248 1144 1144 1162 1162 1733 1733 1789 1789 1887 1887 LSUHSC LSUHSC % 19% 19% 18% 18% 19% 19% 19% 19% 22% 22% 29% 29%

LSUHSC LSUHSC Acceptance Acceptance Rate of Rate of Qualified Qualified Applicants Applicants

74% 74% 63% 63% 73% 73% 46% 46% 42% 42% 31% 31%

BSN Admissions BSN Admissions

2000 2000-

  • 1

1 2001 2001-

  • 2

2 2002 2002-

  • 3

3 2003 2003-

  • 4

4 2004 2004-

  • 5

5 2005 2005-

  • 6

6 2006 2006-

  • 7

7 LSUHSC LSUHSC 175 175 133 133 165 165 152 152 169 169 171 171 217* 217* SU SC SU SC 5 33 33 65 65 5 69 69 LA Total LA Total 1125 1125 1032 1032 1182 1182 1280 1280 1492 1492 1557 1557 LSUHSC LSUHSC % 16% 16% 13% 13% 14% 14% 12% 12% 11% 11% 11% 11%

BSN Graduates BSN Graduates

2000 2000-

  • 1

1 2001 2001-

  • 2

2 2002 2002-

  • 3

3 2003 2003-

  • 4

4 2004 2004-

  • 5

5 2005 2005-

  • 6

6 2006 2006-

  • 7

7 LSUHSC LSUHSC 113 113 114 114 120 120 124 124 153 153 146 146 172* 172* LA Total LA Total 859 859 881 881 859 859 745 745 1006 1006 994 994 LSUHSC LSUHSC % 13% 13% 13% 13% 14% 14% 17% 17% 15% 15% 15% 15%

slide-2
SLIDE 2

4/24/2007 2

NCLEX NCLEX-

  • RN

RN

2000 2000 2001 2001 2002 2002 2003 2003 2004 2004 2005 2005 2006 2006 LSUHSC LSUHSC 93.8 93.8 95.6 95.6 89.4 89.4 92.6 92.6 92.2 92.2 94.62 94.62 88.97 88.97 LSUHSC LSUHSC 93.8 93.8 95.6 95.6 89.4 89.4 92.6 92.6 92.2 92.2 94.62 94.62 88.97 88.97 National National 83.8 83.8 85.5 85.5 86.7 86.7 87.0 87.0 85.0 85.0 80.7 80.7 88.11 88.11

MN Enrollment MN Enrollment

2002 2002-

  • 3

3 2003 2003-

  • 4

4 2004 2004-

  • 5

5 2005 2005-

  • 6

6 2006 2006-

  • 7

7 LSUHSC LSUHSC 78 78 138 138 168 168 201 201 184 184 LA Total LA Total 364 364 469 469 489 489 466 466 LSUHSC % LSUHSC % 21% 21% 29% 29% 34% 34% 43% 43%

MN Graduates MN Graduates

2002 2002-

  • 3

3 2003 2003-

  • 4

4 2004 2004-

  • 5

5 2005 2005-

  • 6

6 2006 2006-

  • 7

7 LSUHSC LSUHSC 17 17 6 6 36 36 49 49 59* 59* LA Total LA Total 120 120 80 80 126 126 166 166 LSUHSC % LSUHSC % 14% 14% 8% 8% 29% 29% 30% 30%

Enrollment Fall 2006 Fall 2006 Spring 2007 Spring 2007 Total BSN Total BSN 501 501 521 521 BSN BSN – – generic generic 410 410 423 423 CARE CARE 61 61 69 69 RN to BSN RN to BSN 30 30 29 29 RN to MN RN to MN 3 3 3 3 Total MN Total MN 190 190 184 184 Nurse Anesthesia Nurse Anesthesia 130 130 125 125 CNS/ADM CNS/ADM 16 16 14 14 ND/NG ND/NG 17 17 19 19 Practitioner/CHN Practitioner/CHN 41 41 42 42 DNS DNS 29 29 28 28 TOTAL SON TOTAL SON 741 741 752 752

Faculty* Faculty*

2000 2000-

  • 1

1 2001 2001-

  • 2

2 2002 2002-

  • 3

3 2003 2003-

  • 4

4 2004 2004-

  • 5

5 2005 2005-

  • 6

6 2006 2006-

  • 7

7

Total Total LSUHSC LSUHSC Faculty Faculty 59 59 65 65 51 51 52 52 62 62 75 75 77 77 Full Full-

  • Time

Time 50 50 51 51 42 42 44 44 47 47 64 64 Part Part- 9 9 14 14 9 9 8 8 15 15 11 11

*LSUHSC Faculty teach in BSN, MN and DNS program *LSUHSC Faculty teach in BSN, MN and DNS program simultaneously simultaneously

Time Time Total LA Total LA BSN BSN Faculty Faculty 349 349 367 367 343 343 364 364 405 405 426 426 LSUHSC LSUHSC % % Faculty Faculty 17% 17% 18% 18% 15% 15% 14% 14% 15% 15% 18% 18%

Faculty Needs to Increase Faculty Needs to Increase Enrollment by 30 students Enrollment by 30 students

Fall 2007 Fall 2007 4.0 FTE 4.0 FTE

$361,200 to $412,800 (4 $361,200 to $412,800 (4 Instructors @$70 000 or 4 Instructors @$70 000 or 4 Instructors @$70,000 or 4 Instructors @$70,000 or 4

  • Asst. Professors @ $80,000
  • Asst. Professors @ $80,000

including 29% fringe) including 29% fringe)

Spring 2008 Spring 2008 10.0 FTE 10.0 FTE

$903,000 to $1,032,000 (10 $903,000 to $1,032,000 (10 Instructors @ $70,000 or 10 Instructors @ $70,000 or 10

  • Asst. Professors @ $80,000
  • Asst. Professors @ $80,000

including 29% fringe) including 29% fringe)

Fall 2008 Fall 2008 12 FTE 12 FTE

$1,083,600 to $1,238,400 $1,083,600 to $1,238,400 (12 Instructors @ $70,000 (12 Instructors @ $70,000

  • r 12 Asst. Professors @
  • r 12 Asst. Professors @

$80,000 including 29% $80,000 including 29% fringe) fringe)

slide-3
SLIDE 3

4/24/2007 3

Resources Needed to Increase Resources Needed to Increase Enrollment Enrollment

  • Qualified Faculty

Qualified Faculty

  • Clinical facilities to accommodate student clinical

Clinical facilities to accommodate student clinical learning experiences learning experiences

  • Office space for increase in faculty numbers

Office space for increase in faculty numbers

  • Increase in classroom space to accommodate

Increase in classroom space to accommodate classes of 100+ students classes of 100+ students

  • Clinical laboratory space to accommodate

Clinical laboratory space to accommodate undergraduate classes of 100+ students undergraduate classes of 100+ students

Resources Needed to Increase Resources Needed to Increase Enrollment Enrollment

  • Infrastructure to support increased

Infrastructure to support increased students and faculty students and faculty

– Computers Computers p – Clerical assistance Clerical assistance – Student affairs personnel Student affairs personnel

  • Increase faculty support to basic science

Increase faculty support to basic science departments departments