
SLIDE 1
1
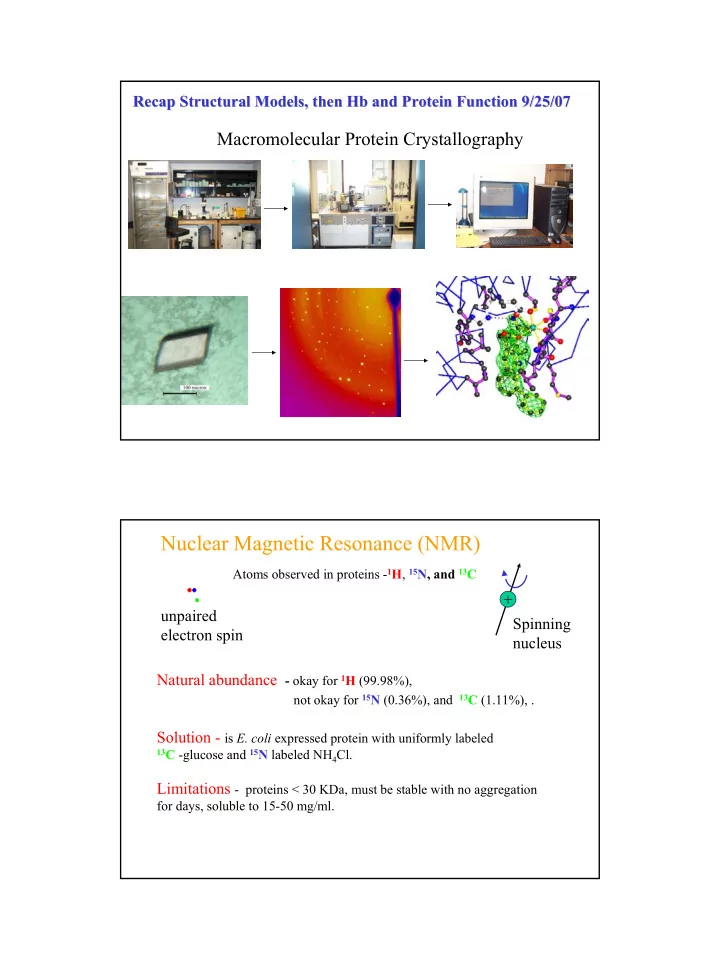
Macromolecular Protein Crystallography
Recap Structural Models, then Recap Structural Models, then Hb Hb and Protein Function 9/25/07 and Protein Function 9/25/07
Nuclear Magnetic Resonance (NMR)
unpaired electron spin + Spinning nucleus Natural abundance - okay for 1H (99.98%),
not okay for 15N (0.36%), and 13C (1.11%), .
Solution - is E. coli expressed protein with uniformly labeled
13C -glucose and 15N labeled NH4Cl.