
SLIDE 1
~
TR 9903--01
NUCLEAR ISSUES
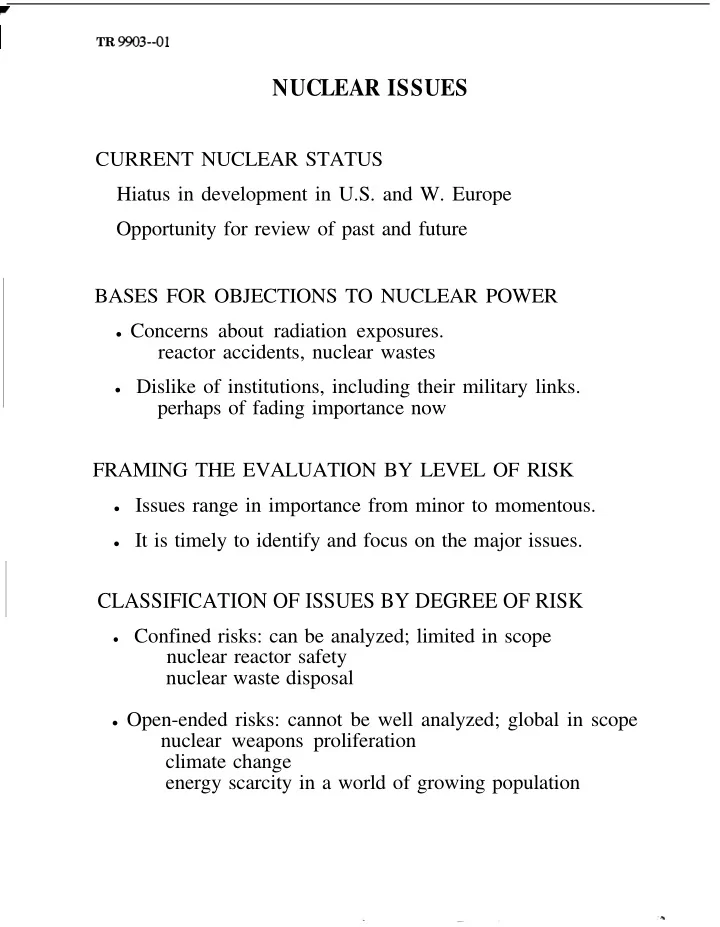
CURRENT NUCLEAR STATUS Hiatus in development in U.S. and W. Europe Opportunity for review of past and future BASES FOR OBJECTIONS TO NUCLEAR POWER
Concerns about radiation exposures.
reactor accidents, nuclear wastes
Dislike of institutions, including their military links.
perhaps of fading importance now FRAMING THE EVALUATION BY LEVEL OF RISK
Issues range in importance from minor to momentous. It is timely to identify and focus on the major issues.
CLASSIFICATION OF ISSUES BY DEGREE OF RISK
Confined risks: can be analyzed; limited in scope
nuclear reactor safety nuclear waste disposal
Open-ended risks: cannot be well analyzed; global in scope