SLIDE 25 28 March 2014 12 February 2014
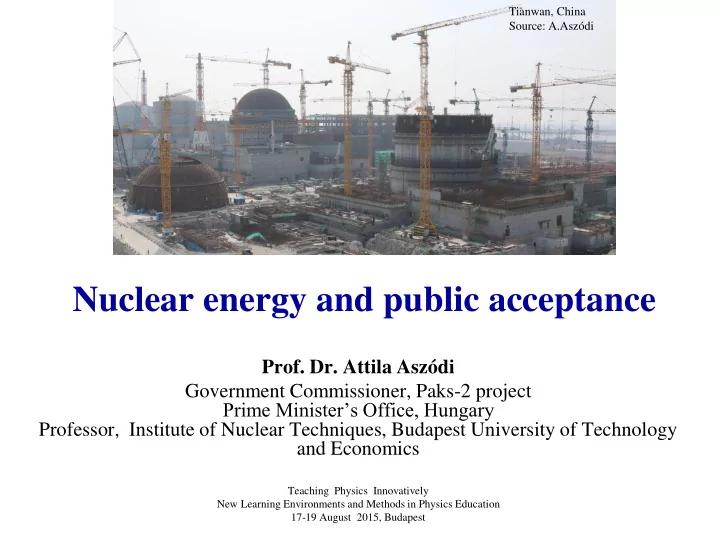
New units at Paks NPP
14 January 2014 Intergovernmental Agreement (IGA) About the cooperation on the peaceful use of nuclear energy a Act II/2014 About the announcement of the IGA, in force on 12 February 30 June 2014 1358/2014. (VI.30) Govt. decree About the nomination of a government commissioner on the Paks-2 project 23 June 2014 Act XXIV/2014 About the announcement of the FIGA Intergovernmental Agreement (Financial IGA) About the interstate loan for the extension of Paks NOO
- Paks NPP: extension on the agenda since the
80’s
- 30th March, 2009: decision-in-principle of the
Hungarian Parliament about new units
- 2012: establishment of MVM Paks II. Nuclear
Power Plant Development Ltd
- January 2014: Intergovernmental agreement
- n the peaceful use of nuclear energy by
Russia and Hungary
– Two VVER-1200 type reactors at the Paks site – Russian loan for the 80% of construction costs – Key point of the IGA: 40% localization level (share of domestic suppliers) – Nuclear fuel supply is available from the Russian party – Spent fuel management (interim storage or reprocessing in Russia), while the spent fuel or the residual waste (in case of reprocessing) will be transferred back to Hungary
12/10/2015
9 December 2014 Implementation agreements signed with JSC NIAEP on EPC, operation and maintenance support and nuclear fuel supply
25