
SLIDE 1
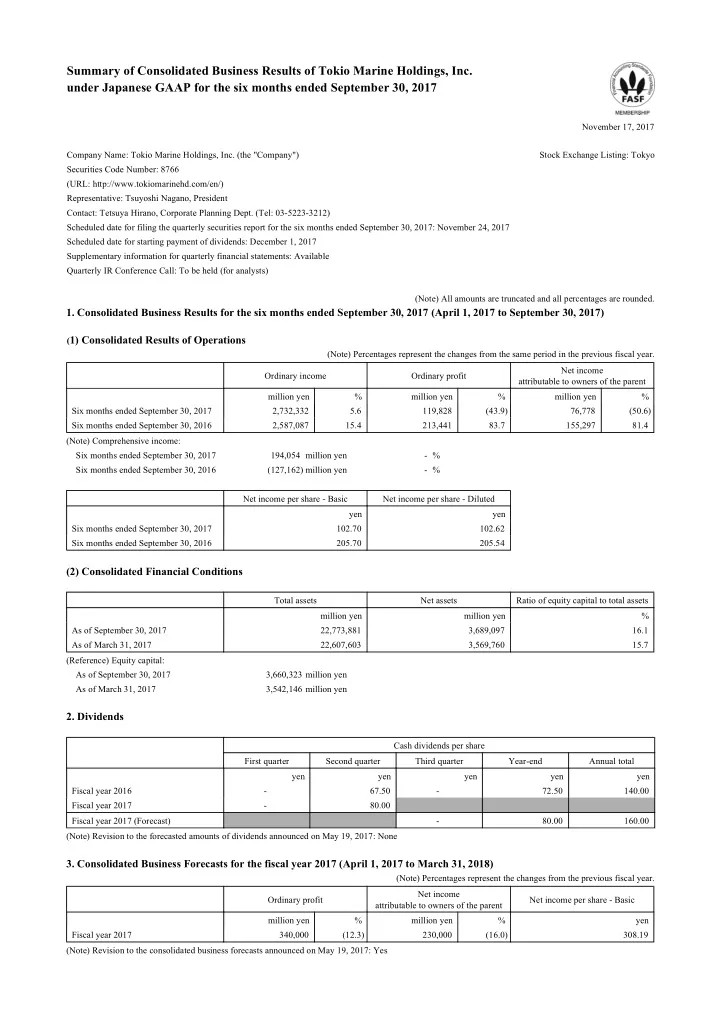
Summary of Consolidated Business Results of Tokio Marine Holdings, Inc. under Japanese GAAP for the six months ended September 30, 2017
November 17, 2017 Company Name: Tokio Marine Holdings, Inc. (the "Company") Stock Exchange Listing: Tokyo Securities Code Number: 8766 (URL: http://www.tokiomarinehd.com/en/) Representative: Tsuyoshi Nagano, President Contact: Tetsuya Hirano, Corporate Planning Dept. (Tel: 03-5223-3212) Scheduled date for filing the quarterly securities report for the six months ended September 30, 2017: November 24, 2017 Scheduled date for starting payment of dividends: December 1, 2017 Supplementary information for quarterly financial statements: Available Quarterly IR Conference Call: To be held (for analysts) (Note) All amounts are truncated and all percentages are rounded.
- 1. Consolidated Business Results for the six months ended September 30, 2017 (April 1, 2017 to September 30, 2017)
(1) Consolidated Results of Operations (Note) Percentages represent the changes from the same period in the previous fiscal year. Ordinary income Ordinary profit Net income attributable to owners of the parent million yen % million yen % million yen % Six months ended September 30, 2017 2,732,332 5.6 119,828 (43.9) 76,778 (50.6) Six months ended September 30, 2016 2,587,087 15.4 213,441 83.7 155,297 81.4 (Note) Comprehensive income: Six months ended September 30, 2017 194,054 million yen
- %
Six months ended September 30, 2016 (127,162) million yen
- %
Net income per share - Basic Net income per share - Diluted yen yen Six months ended September 30, 2017 102.70 102.62 Six months ended September 30, 2016 205.70 205.54
(2) Consolidated Financial Conditions
Total assets Net assets Ratio of equity capital to total assets million yen million yen % As of September 30, 2017 22,773,881 3,689,097 16.1 As of March 31, 2017 22,607,603 3,569,760 15.7 (Reference) Equity capital: As of September 30, 2017 3,660,323 million yen As of March 31, 2017 3,542,146 million yen
- 2. Dividends
Cash dividends per share First quarter Second quarter Third quarter Year-end Annual total yen yen yen yen yen Fiscal year 2016
- 67.50
- 72.50
140.00 Fiscal year 2017
- 80.00
Fiscal year 2017 (Forecast)
- 80.00
160.00 (Note) Revision to the forecasted amounts of dividends announced on May 19, 2017: None
- 3. Consolidated Business Forecasts for the fiscal year 2017 (April 1, 2017 to March 31, 2018)