Norwegian Air Shuttle ASA Q3 2011 Presentation October 20 th 2011 - - PDF document

norwegian air shuttle asa
SMART_READER_LITE
LIVE PREVIEW

Norwegian Air Shuttle ASA Q3 2011 Presentation October 20 th 2011 - - PDF document

Norwegian Air Shuttle ASA Q3 2011 Presentation October 20 th 2011 CEO Bjrn Kjos Double digit revenue growth in Q3 Group revenues of MNOK 3,376 in Q3 2011 Slide: 2 Q3 operating result (EBITDA) of 1 Billion NOK, improved by 378 million


slide-1
SLIDE 1

Norwegian Air Shuttle ASA

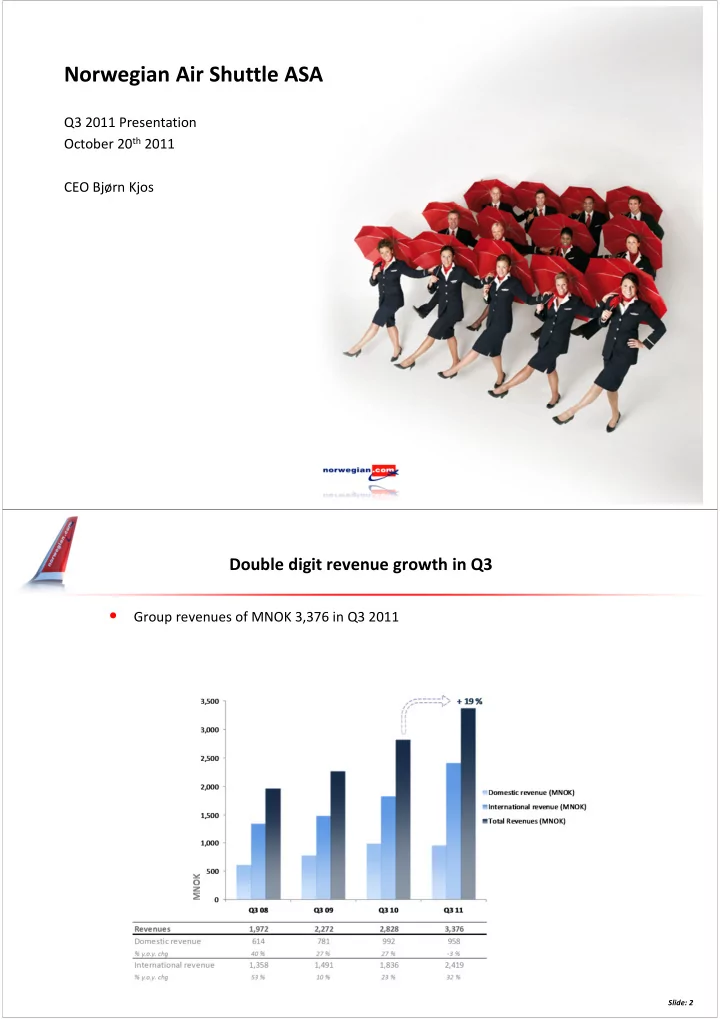
Q3 2011 Presentation October 20th 2011 CEO Bjørn Kjos

Double digit revenue growth in Q3

  • Group revenues of MNOK 3,376 in Q3 2011

Slide: 2

slide-2
SLIDE 2

Q3 operating result (EBITDA) of 1 Billion NOK, improved by 378 million from last year

– EBITDAR MNOK + 1,206

(840)

– EBITDA MNOK + 1,001

(624)

– EBIT MNOK + 923

(573) .

– Pre-tax profit (EBT) MNOK + 686

(733)

– Net profit MNOK + 495

(528)

Slide: 3

EBITDA development Q3 EBITDAR development Q3

Underlying EBITDA improvement of MNOK 546

4

  • Fuel price up 48 % since last year – equivalent to MNOK 265
  • More efficient aircraft saves MNOK 47
  • USD hedges designed to counter balance sheet agio/disagio from USD liabilities
slide-3
SLIDE 3

Cash and cash equivalents of 1.4 billion, up MNOK 249 from last year

5

  • Cash flows from operations in Q3 2011

MNOK +243 (-48)

  • Cash flows from investing activities in Q3 2011

MNOK -801 (-479)

  • Cash flows from financing activities in Q3 2011

MNOK +768 (+127)

  • Cash and cash equivalents at period-end

MNOK +1,430 (+1,181)

1,181 Cash 1,430 1,253 Receivables 1,577 4,047 Non-current assets 6,035

1,000 2,000 3,000 4,000 5,000 6,000 7,000 8,000 9,000 Q3 10 Q3 11

MNOK

Equity 2,059 1,799 Pre-sold tickets 1,354 1,067 Other current liabilities 2,063 1,864 Long term liabilities 3,565 1,752

Q3 11 Q3 10

  • Total balance of NOK 9.0 billion
  • Equity of NOK 2.1 billion at the end of the third quarter
  • Group equity ratio of 23 % (28 %)

Group equity improved by MNOK 260 compared to last year

Slide: 6 Slide: 6

slide-4
SLIDE 4

Equity 2,059 Pre-sold tickets 1,354 current liabilities 2,063 LT liabilities 3,565

Q3 11 (aircraft sold) Q3 11 (actual)

1,430 Cash 1,577 Receivables 6,035 Non-current assets

1,000 2,000 3,000 4,000 5,000 6,000 7,000 8,000 9,000 Q3 11 (actual) Q3 11 (aircraft sold)

MNOK

Flexibility to increase Equity ratio from 23 % to 45 %

7

  • Liquidating on-balance sheet aircraft would double the equity ratio
  • Would generate capital gains and cash
  • Norwegian to own aircraft to keep cost down

ASK 3,590 3,979 5,331 6,480 Load Factor 82 % 82 % 80 % 84 %

82 % 82 % 80 % 84 %

0 % 20 % 40 % 60 % 80 % 100 % 1,000 2,000 3,000 4,000 5,000 6,000 7,000 Q3 08 Q3 09 Q3 10 Q3 11 Load Factor Available Seat KM (ASK)

ASK Load Factor

+ 22 %

Traffic growth of 27 % in Q3

  • Load up 4 p.p. despite capacity growth of 22 %
  • Unit revenue (RASK) up 6 %

Slide: 8 Slide: 8

slide-5
SLIDE 5

Passengers (million) 2.6 3.1 3.8 4.6 0.0 0.5 1.0 1.5 2.0 2.5 3.0 3.5 4.0 4.5 5.0 Q3 08 Q3 09 Q3 10 Q3 11 Passengers (million) + 21 %

  • 4.6 million passengers, 21 % growth from last year
  • An increase of 790,000 passengers

Passenger record in Q3

Slide: 9 Slide: 9

  • New dom. routes to Malmö & Gothenburg
  • Substantial international production growth

Largest share of growth outside Norway

Newly started base in Helsinki with 340.000 passengers in Q3

Norwegian in Oslo + 126,000 pax

  • Marginal increase in domestic frequencies
  • Growth due to larger aircraft and charter

Norwegian in Stockholm + 308,000 pax Norwegian in Copenhagen + 88,000 pax

  • International production growth
slide-6
SLIDE 6
  • Flying cost of 737-800 lower than 737-300
  • 737-800 has 38 “free” seats
  • 6 % lower unit fuel consumption in Q3

Norwegian aiming for CASK NOK 0.30 excluding fuel

11

Scale economies Scale economies New more efficient aircraft New more efficient aircraft Growth adapted to int’l markets Growth adapted to int’l markets Crew and aircraft utilization Crew and aircraft utilization Optimized average stage length Optimized average stage length Automation Automation

  • Uniform fleet of Boeing 737-800s
  • Overheads
  • Fixed costs divided by more ASKs
  • Frequency based costs divided by more ASKs
  • Q3 stage length up by 4 %
  • Salaries adapted to international cost levels
  • Outsourcing/ Off-shoring
  • 205 employees in the Baltics (admin and ops)
  • Rostering and aircraft slings optimized
  • Q3 utilization of 11.7 BLH pr a/c
  • Self check-in/ bag drop
  • Automated charter & group bookings
  • Streamlined operative systems & processes

Cost per ASK (CASK) (NOK) 0.49 0.44 0.41 0.41 CASK excl. fuel & hedge gain 0.30 0.32 0.30 0.27

0.30 0.32 0.30 0.23 0.04

0.19 0.12 0.11 0.14 0.20 0.25 0.30 0.35 0.40 0.45 0.50 Q3 08 Q3 09 Q3 10 Q3 11 Operating cost EBITDA level per ASK (CASK)

Fuel share of CASK CASK excl fuel

  • 10 %

Cost reducing hedge-effect Underlying CASK Reported CASK

Underlying unit cost down 10 %

  • Unit cost incl. fuel & excl. hedge gain down 2 % in spite of 48 % higher fuel price
  • More efficient aircraft saved MNOK 89 in fuel cost in Q3 (NOK 0.014 per ASK)
  • Unit cost excl. fuel & hedge gain 0.27 - Down 10 % from last year

Slide: 12 Slide: 12

slide-7
SLIDE 7

Larger aircraft & improving utilization reduce unit cost

13

  • Improving utilization and larger aircraft offset highest salary cost in the industry
  • Still an upside from smarter rostering and seasonal adaptions

Salary cost per ASK (12 mths rolling) Salary cost per employee

Ancillary revenue/ scheduled pax 56 80 84 83 Ancillary revenue/ all pax (inc. charter) 56 79 84 80 10 20 30 40 50 60 70 80 90 Q3 08 Q3 09 Q3 10 Q3 11

Ancillary revenue per passenger (NOK)

Ancillary revenues remains a significant contributor

Slide: 14 Slide: 14

  • High growth in new markets
  • Ancillary revenue comprises 11 % of Q3 revenues (target 15 %)
slide-8
SLIDE 8

World class punctuality and regularity

15

  • Punctuality of 88 % in Q3
  • High punctuality combined with high regularity (few cancellations)
  • Continuous work saves cost and improves satisfaction

Target

Customer satisfaction in Sweden

Noteworthy change with «clean» -800 base & WiFi

16

Comfort on board Leg room

slide-9
SLIDE 9

Long-haul business idea:

Lowest overhead costs – most efficient aircraft – untapped market

  • Six Boeing 787-8 Dreamliners on order
  • Leveraging on existing overhead cost efficiency

Slide: 17 Short-haul Long-haul

Current planned fleet development

18

  • 61 aircraft in the fleet at end of Q3

– 737-800: 44 (increase of 15 since last year) – 737-300: 17 (decrease of 11 since last year)

  • 2 new 737-800 deliveries in Q4

– 1 lease – 1 owned

slide-10
SLIDE 10
  • Business environment

– Uncertain business climate – Seasonal fluctuations – Continued but stabilized yield pressure

  • Production

– The company expects a production growth (ASK) of approximately 24 % – Primarily from increasing the fleet by adding 737-800’s – Capacity deployment depending on development in the overall economy and marketplace

  • Cost development

– Unit cost expected in the area of 0.46 (excluding hedged volumes)

  • Fuel price dependent – USD 850 pr. ton (excluding hedged volumes)
  • Currency dependent – USD/NOK 6.00 (excluding hedged volumes)
  • Based on the current route portfolio
  • Larger share of aircraft with more capacity and lower unit cost

Expectations for 2011

Slide: 19 Slide: 19

Expectations for 2012

Slide: 20 Slide: 20

  • The company expects a production growth (ASK) of 15 %

– Primarily by replacing Boeing 737-300s with Boeing 737-800s – Continuous optimization of the route portfolio

  • Unit cost expected in the area NOK 0.43 - 0.44

– Fuel price dependent – USD 850 per ton – Currency dependent – USD/NOK 6.00 – Production dependent – Based on the current route portfolio

slide-11
SLIDE 11

Norwegian offers 265 scheduled routes to 102 destinations

Norwegian Air Shuttle ASA

Mailing address P.O. Box 113 No – 1330 Fornebu Visiting address Oksenøyveien 3 Telephone +47 67 59 30 00 Telefax +47 67 59 30 01 Internet www.norwegian.com Organization number NO 965 920 358 MVA

Slide: 22