
SLIDE 1
non stomatal limitation of photosynthesis European 2018 drought - - PowerPoint PPT Presentation
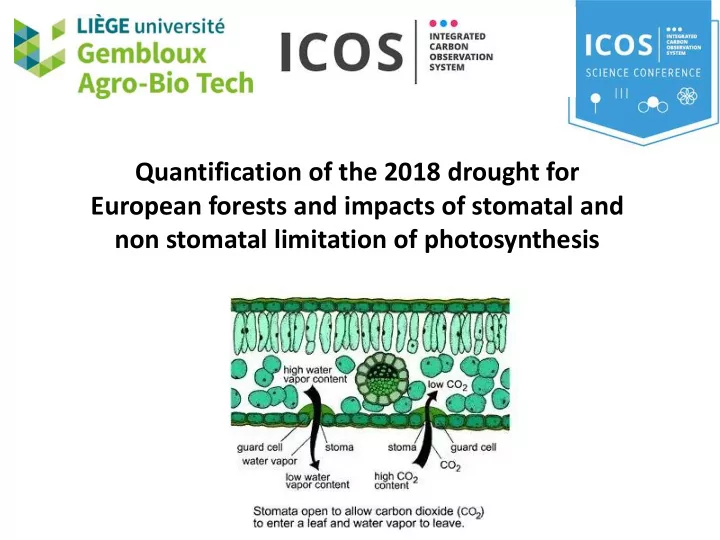
Quantification of the 2018 drought for European forests and impacts of stomatal and non stomatal limitation of photosynthesis European 2018 drought European Drought Observatory, combined drought indicator (CDI) Drought taskforce ->
European Drought Observatory, combined drought indicator (CDI) Drought taskforce -> Philosophical transaction of the royal society B
NPP (g C m-2) Precipitation Temperatures Ciai et al., 2005 (Nature)
GPP Respiration
Non-stomatal Stomatal
Ci gm
Cc
gs
Damour, 2008
Figure from Zhou et al., 2019 Ca gs gm Ci
Cc
Non-stomatal Stomatal 𝐻𝑄𝑄
𝑑 = 𝑊 𝑑𝑛𝑏𝑦(𝐷𝑗 − Γ ∗)
(𝐷𝑗 + 𝐿𝑛) 𝐷𝑗 = 𝐷𝑏 − 𝐻𝑄𝑄 𝑡,𝑑𝑝2 𝑡,𝐼2𝑃 = 0 + 1.6(1 + 1 √𝑊𝑄𝐸) 𝐻𝑄𝑄 𝐷𝑏 At light saturation : gs,𝐼2𝑃 = LEGaγ s Rn − G − S + ρCpCaVPDa − LE(s + γ) gs can be obtained from PM equation
Medlyn et al.,2011
𝑡,𝐼2𝑃 1.6 = 𝑡,𝐷𝑃2
𝐻𝑄𝑄 = 𝑊
𝑑𝑛𝑏𝑦(𝐷𝑗 − Γ ∗)
(𝐷𝑗 + 𝐿𝑛) 𝐷𝑗 = 𝐷𝑏 − 𝑯𝑸𝑸 𝒉𝒅 𝑡 = 0 + 1.6(1 + 1 √𝑊𝑄𝐸) 𝐻𝑄𝑄 𝐷𝑏 Non stomatal limitation Stomatal limitation Changes in apparent Vcmax with measured Ci values Changes in Ci which are associated with changes in g1 (changes in the GPP-gs slope) g1 is inversely proportional to iWUE 𝐻𝑄𝑄 𝑊𝑄𝐸𝐷𝑏 𝑡 1
REWt = SWCt − SWCWP SWCFC − SWCWP Soil humidity sensors REW varies from 1 (Field capacity) and 0 (wiliting point) Cumulated over the root zone
No consistant stomatal behavior across ecosystems Recall : g1 is inversely proportional to iWUE
Non stomatal limitations are observed at almost all sites where REW felt < 0.4
In most ecosystems, non-stomatal limitation is the dominant mechanism Decrease of apparent Vcmax could be the result of both diffusional effects (mesophyll conductance) or biochemical effects
In term of water use efficiency (iWUE) we observe :
(GPP is already too low)
𝑡,𝐼2𝑃 = 0 + 1.6(1 + 1 √𝑊𝑄𝐸) 𝐻𝑄𝑄 𝐷𝑏 How should plante regulate stomata ? (Cowan & Farquhar, 1977) Stomata regulate both photosynthesis and transpiration Stomata should maximise : 𝐵 − λE where λ is the carbon cost of water. g1~
1
λ If λ = 𝜀𝐵
𝜀𝐹 = 𝑑𝑝𝑜𝑡𝑢𝑏𝑜𝑢 (water spent now can’t be spent later) but
does not apply when water availbility decrease !
g1 ↘) Makëla et al., 1996 Results from this study do no support this ! the costs of stomatal opening are probably not well identified Ideas :
Dewar et al., 2018