
SLIDE 1
Quantification of the 2018 drought for European forests and impacts - - PowerPoint PPT Presentation
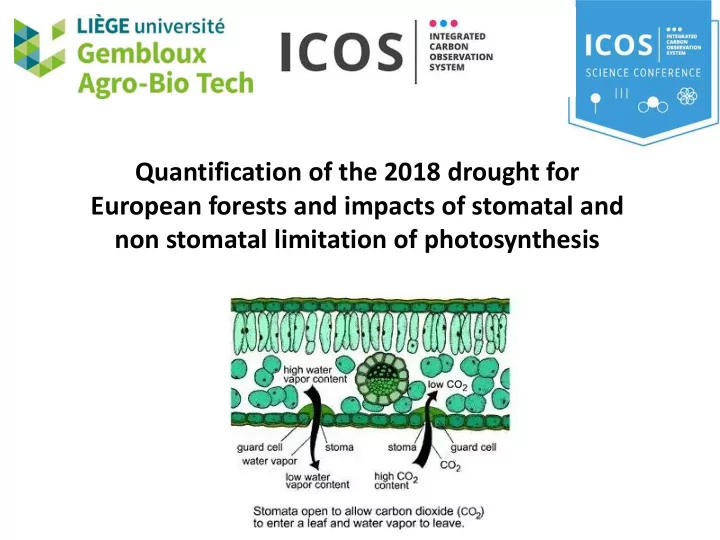
Quantification of the 2018 drought for European forests and impacts of stomatal and non stomatal limitation of photosynthesis European 2018 drought European Drought Observatory, combined drought indicator (CDI) Drought taskforce ->
European Drought Observatory, combined drought indicator (CDI) Drought taskforce -> Philosophical transaction of the royal society B
Figure from Zhou et al., 2019 Ca gs gm Ci
Cc
Non-stomatal Stomatal 𝐻𝑄𝑄
𝑑 = 𝑊 𝑑𝑛𝑏𝑦(𝐷𝑗 − Γ ∗)
(𝐷𝑗 + 𝐿𝑛) 𝐷𝑗 = 𝐷𝑏 − 𝐻𝑄𝑄 𝑡,𝑑𝑝2 𝑡,𝐼2𝑃 = 0 + 1.6(1 + 1 √𝑊𝑄𝐸) 𝐻𝑄𝑄 𝐷𝑏 At light saturation : gs,𝐼2𝑃 = LEGaγ s Rn − G − S + ρCpCaVPDa − LE(s + γ) gs can be obtained from PM equation
Medlyn et al.,2011
𝑡,𝐼2𝑃 1.6 = 𝑡,𝐷𝑃2
𝐻𝑄𝑄 = 𝑊
𝑑𝑛𝑏𝑦(𝐷𝑗 − Γ ∗)
(𝐷𝑗 + 𝐿𝑛) 𝐷𝑗 = 𝐷𝑏 − 𝑯𝑸𝑸 𝒉𝒅 𝑡 = 0 + 1.6(1 + 1 √𝑊𝑄𝐸) 𝐻𝑄𝑄 𝐷𝑏 Non stomatal limitation Stomatal limitation Changes in apparent Vcmax with measured Ci values Changes in Ci which are associated with changes in g1 (changes in the GPP-gc slope) g1 is inversely proportional to iWUE 𝐻𝑄𝑄 𝑊𝑄𝐸𝐷𝑏 𝑡 1
REWt = SWCt − SWCWP SWCFC − SWCWP Soil humidity sensors REW varies from 1 (Field capacity) and 0 (wiliting point) Cumulated over the root zone
Site ID Country Latitute Longitude Dominating species Soil texture Precipitation Mean 2018 Difference BE-BRA Belgium 51.308 4.52Pinus Syvlestris sand 819 724 95 BE-VIE Belgium 50.305 5.998 Fagus sylvatica/Pseudotsuga Menziesii silty clay loam 898 592 305 CZ-LNZ Czech 48.682 16.946 Quercus robur/Fraxinus angustifolia/Carpinus betulus/Tilia cordata sandy loam 445 438 7 CZ-RAJ Czech 49.444 16.697Picea abies sandy loam 622 474 148 CZ-STN Czech 49.036 17.97Fagus Sylvatica sandy loam 644 457 187 DE-HAI Germany 51.079 10.453Fagus Sylvatica clay loam 734 511 223 DK-SOR Denmark 55.486 11.645Fagus Sylvatica sandy clay loam 837 399 438 FR-BIL France 44.494
sand 892 884 8 FR-HES France 48.674 7.065Fagus Sylvatica silty clay loam 827 737 90 IT-SR2 Italy 43.732 10.291Pinus Pinea sandy 1078 908 170
No consistant stomatal behavior across ecosystems Recall : g1 is inversely proportional to iWUE
Non stomatal limitations are observed at almost all sites where REW felt < 0.4
In most ecosystems, non-stomatal limitation is the dominant mechanism Decrease of apparent Vcmax could be the result of both diffusional effects (mesophyll conductance) or biochemical effects
In term of water use efficiency (iWUE) we observe :
(GPP is already too low)
𝑡,𝐼2𝑃 = 0 + 1.6(1 + 1 √𝑊𝑄𝐸) 𝐻𝑄𝑄 𝐷𝑏 How should plante regulate stomata ? (Cowan & Farquhar, 1977) Stomata regulate both photosynthesis and transpiration Stomata should maximise : 𝐵 − λE where λ is the carbon cost of water. g1~
1
λ If λ = 𝜀𝐵
𝜀𝐹 = 𝑑𝑝𝑜𝑡𝑢𝑏𝑜𝑢 (water spent now can’t be spent later) but
does not apply when water availbility decrease !
g1 ↘) Makëla et al., 1996 Results from this study do no support this ! the costs of stomatal opening are probably not well identified Ideas :
Dewar et al., 2018