our changing forests
play

Our Changing Forests Harvard Forest Schoolyard Project August 22, - PowerPoint PPT Presentation

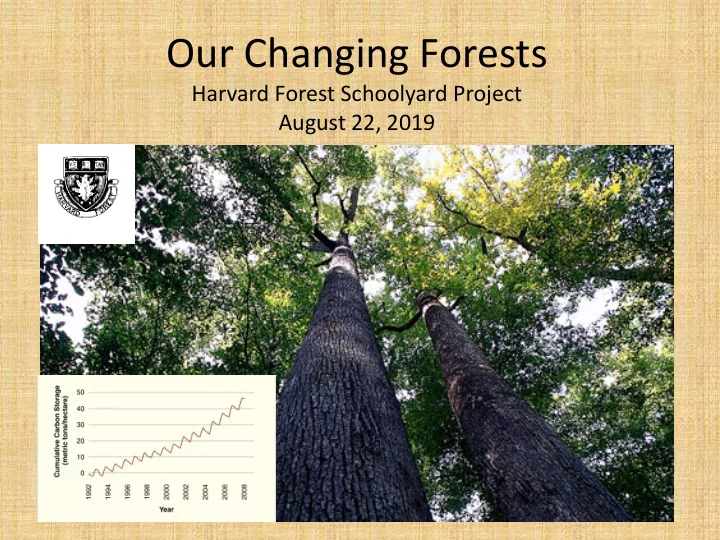
Our Changing Forests Harvard Forest Schoolyard Project August 22, 2019 1. How do forests change? 2. What are the implications of forest change? 3. How do we measure forest change? 1. How do forests change? Slowly: New trees get


  1. Our Changing Forests Harvard Forest Schoolyard Project August 22, 2019

  2. 1. How do forests change? 2. What are the implications of forest change? 3. How do we measure forest change?

  3. 1. How do forests change? Slowly: • New trees get established reproduction • Trees grow Seed • Trees die survival Seedling survival Tree

  4. 1. How do forests change? Rapidly: Disturbance Background Weather – ice, snow, wind, hurricanes Pre-colonial Fire, in some places Colonial – Early Industrial Forest clearance (lumber, farming, cities) Fire Modern Forest regrowth Forest fragmentation Atmospheric pollution Pest outbreaks Future Climate change Development Pollution

  5. 1. How do forests change? Rapidly: Disturbance

  6. 2. Implications of forest change • Species composition

  7. 2. Implications of forest change • Forest structure carbon carbon

  8. 2. Implications of forest change Carbon Storage

  9. 3. How do we track forest change? • Plots • Used by ecologists, conservationists, land managers around the world

  10. Changing Forests Protocol 10 meters Year 1 1. Establish and permanently mark at least one 10 x 10 meter square plot 10 meters 2. Measure all trees and shrubs at least 2.5 cm in diameter a. record species b. record the tree diameter at “breast height” c. record whether alive or dead d. mark each stem with a numbered tag 3. Record field site characteristics about the plot Year 2 Establish 2 nd 10 x 10 meter plot

  11. Changing Forests Protocol • Return to each plot every 2-3 years and repeating tree measurements. • Comparing initial measurements to subsequent measurements to determine change over time

  12. Where do you put your Plot? • What forest do you have available near your school? • What type of forest do you want to study? (old, young, hemlock, oak etc. Hints: • At least 8-10 trees in the plot • Not too conspicuous • Basic Monitoring (schoolyard): examines what is changing in the plot, but does not address why changes are occurring) • Comparative or Question Driven Monitoring (advanced): how is a particular disturbance changing the forest

  13. Laying out the Plot E N The picture can't be displayed. 10 meters S W 10 meters Hint: set up two sides of the square and then check the diagonal (14.2meters). Find where 14.2 meters meets up with 10 meters in corner. Repeat with diagonal for other two sides.

  14. Data Sheet-Field Site Description Harvard Forest Schoolyard Ecology Our Changing Forests Field Site Description Sheet School Name: ____________________Date (month, day, year):______ ____ Teacher Name: ______________________________________________ Plot Number_______ __________ Survey Number___________________ Time Start: Time End Plot Location: County ___________ State ______ Town_____________ GPS Coordinates : Lat____________ Long _____________ Additional Directions Plot: _____________________________________

  15. Data Sheet-Field Site Description Topography/Physical Features : 1. Landscape position – Check one: ridge/hilltop hillside dry flat wet flat rolling upland 2. Slope – Check one: none slight moderate steep 3. Aspect _____ ⁰ 4 . Water in Plot – Check one or more: stream temporary stream flooded area vernal pool 5. Rock Cover in Plot – Check one: <1% 1-5% 6-25% 26-50% 51-75% >75%

  16. Data Sheet-Field Site Description Forest Canopy Characteristics: • Canopy Cover Estimate : (Check One) 1-25%, 25-50%, 51-75% 76-100%

  17. Data Sheet-Field Site Description Evidence of Disturbance: 1. Forest Pests and Pathogens in Plot : Check one or more: Hemlock Woolly Adelgid Gypsy Moth Ash Yellows Asian Long-horned Beetle Beech Bark Disease Emerald Ash Borer Hemlock Borer other___________ None

  18. Data Sheet-Field Site Description Evidence of Disturbance: 2. Human Activity in or Near Plot : Check one or more cut stumps footpath stone wall forest road building cellar hole barbed wire open field skid trail other_______ None

  19. Data Sheet-Field Site Description Evidence of Disturbance: 3. Weather Events in Plot : Check one or more uprooted trees snapped trees large downed branches fire scars river flooding other_____ None 4. Downed Woody Debris Cover in Plot (pieces at least 10 cm in diameter): Check one: <1% 1-5% 6-25% 26-50% 51-75% >75%

  20. Data Sheet-Field Site Description Evidence of Disturbance: 5. Wildlife Sign in Plot: Check one or more deer pellets moose pellets deer/moose browsing moose bark-stripping deer antler rubs tree girdling [porcupine] beaver felled tree woodpecker hole bear claw marks on beech rabbit/porcupine browse other__________ None

  21. Data Sheet-Field Site Description Evidence of Disturbance: 6. Invasive Plant Species in Plot : Check One or More: Garlic Mustard Oriental Bittersweet Japanese Barberry Burning Bush Multiflora Rose Honeysuckle Autumn Olive Buckthorn Japanese Stilt Grass Other None

  22. Tree Identification Tree Species Diameter at Condition Number Breast Height (living, dead) (DBH) Record all stems > 2.5cm DBH #### Chestnut Oak 45.6 Alive woodlandstewardship.org

  23. Measuring the diameter of unusual stems

Download Presentation
Download Policy: The content available on the website is offered to you 'AS IS' for your personal information and use only. It cannot be commercialized, licensed, or distributed on other websites without prior consent from the author. To download a presentation, simply click this link. If you encounter any difficulties during the download process, it's possible that the publisher has removed the file from their server.

Recommend


More recommend