
SLIDE 1
NJNG DIMP
1
NJNG Distribution System Overview
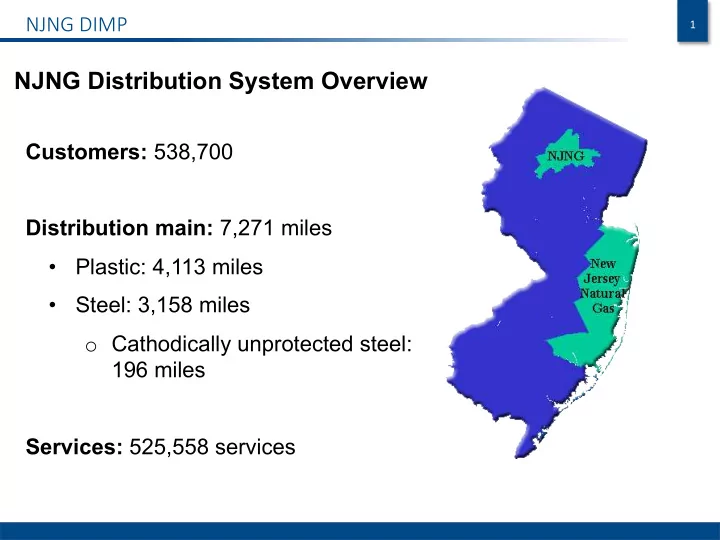
Customers: 538,700 Distribution main: 7,271 miles
- Plastic: 4,113 miles
- Steel: 3,158 miles
- Cathodically unprotected steel: