
SLIDE 1
Newell Highway Upgrade Project
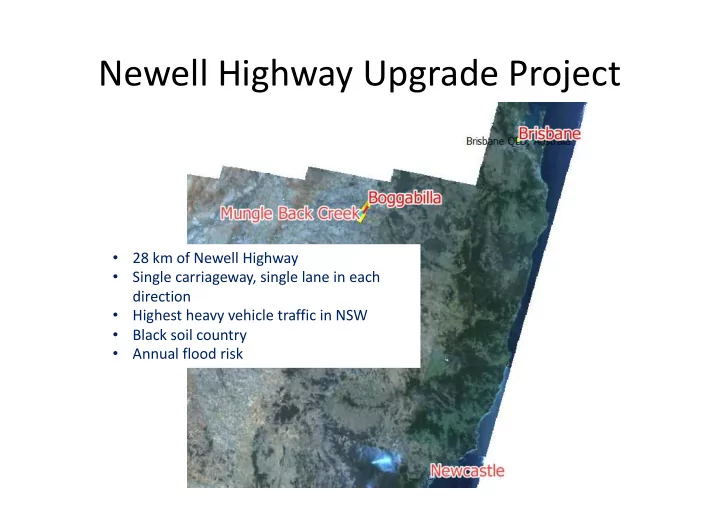
- 28 km of Newell Highway
- Single carriageway, single lane in each
direction
- Highest heavy vehicle traffic in NSW
- Black soil country
- Annual flood risk