
SLIDE 1
NEW YORK STATE DEMOGRAPHICS
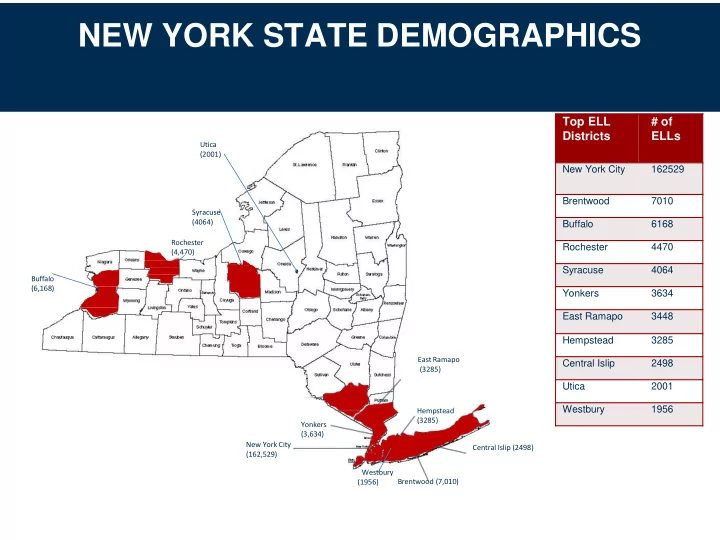
Syracuse (4064) Rochester (4,470) Buffalo (6,168) Hempstead (3285) Yonkers (3,634) New York City (162,529) Utica (2001) Central Islip (2498) East Ramapo (3285)
Top ELL Districts # of ELLs
New York City 162529 Brentwood 7010 Buffalo 6168 Rochester 4470 Syracuse 4064 Yonkers 3634 East Ramapo 3448 Hempstead 3285 Central Islip 2498 Utica 2001 Westbury 1956
Brentwood (7,010) Westbury (1956)