
SLIDE 1
New Computing In 2019 and Beyond - Opportunities, Challenges, and Threats
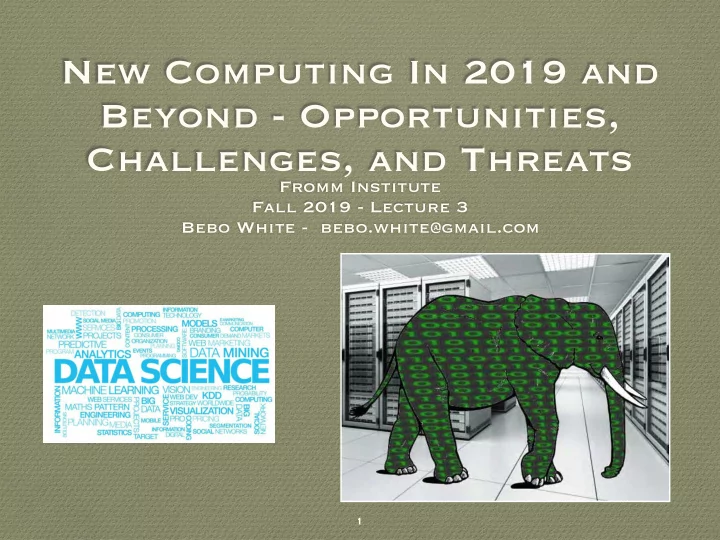
Fromm Institute Fall 2019 - Lecture 3 Bebo White - bebo.white@gmail.com
1
New Computing In 2019 and Beyond - Opportunities, Challenges, and - - PowerPoint PPT Presentation
New Computing In 2019 and Beyond - Opportunities, Challenges, and Threats Fromm Institute Fall 2019 - Lecture 3 Bebo White - bebo.white@gmail.com 1 calendar 2 how big is a billion? how do we describe it? 10 9 = 1,000,000,000 (to a
Fromm Institute Fall 2019 - Lecture 3 Bebo White - bebo.white@gmail.com
1
2
3
4
hiding theorem
manage/use the data you own?
5
6
7
8
9
10
11
12
Linear Coherent Light Source (LCLS)
13
14
15
16
brain has the storage capacity
Data)?
17
18
19
20
21
interactions (including data gathered by connected people and devices)
to be analyzed in near real-time
22
23
24
25
26
analyze (McKinsey Global Institute)
27
1 trillion of these per month
28
29
30
31
~1.125 exabytes/cm3
current storage needs for a year could fit in a m3 cube of DNA
synthesized (written to), and accurately copied
32
33
Oakland A’s to use data to make pragmatic decisions that went against the traditional wisdom of baseball teams
their rivals on a shoestring budget
34
35
36
37
38
39
40
41
42
43
44
45
46
47
instead parsing through massive datasets in sometimes unstructured ways to expose insights
questions in mind that need answers based on existing data
which questions should be asked
being asked
48
security agencies, political influencers, etc.
49
50
“crying with joy” and “holy crap!” (positive)
for Honda, bad for Toyota
network”
I’m never doing business with them again!”
51
52
53
54
technologies are unique, revolutionary, and disruptive
stories that you read/hear
in discussions on these topics
55
56
57
58
59
60
61
62
63
visualization
64
65
66
67
advantageously involves humans to assist a computer to solve particular tasks, allowing the computer to solve the tasks more efficiently.” (from Amazon patent application)
maybe for systems like Alexa?
68
including data that is
69
70
71
72