
SLIDE 1
Neural network applications
To date:
- Neural networks: what are they
- Backpropagation: efficient gradient computation
- Advanced training: (scaled) conjugate gradient
- Adaptive architectures: cascade NN w/NDEKF
Today:
- Neural network applications
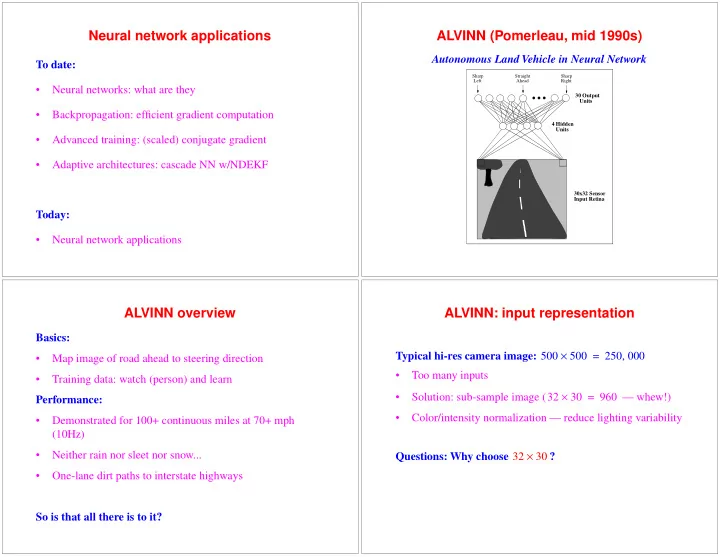
ALVINN (Pomerleau, mid 1990s)
Autonomous Land Vehicle in Neural Network
Sharp Left Sharp Right
4 Hidden Units 30 Output Units 30x32 Sensor Input Retina
Straight Ahead
ALVINN overview
Basics:
- Map image of road ahead to steering direction
- Training data: watch (person) and learn
Performance:
- Demonstrated for 100+ continuous miles at 70+ mph
(10Hz)
- Neither rain nor sleet nor snow...
- One-lane dirt paths to interstate highways
So is that all there is to it?
ALVINN: input representation
Typical hi-res camera image:
- Too many inputs
- Solution: sub-sample image (
— whew!)
- Color/intensity normalization — reduce lighting variability