network traffic analysis cluster analysis
play

Network Traffic Analysis & Cluster Analysis Exploring Hadoop - PowerPoint PPT Presentation

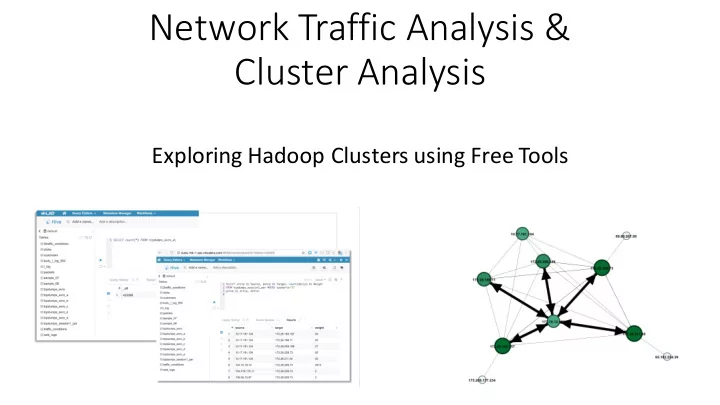
Network Traffic Analysis & Cluster Analysis Exploring Hadoop Clusters using Free Tools Background and Goals: Apache Spot was started recently DNS, Netflow, PCAP data is analyzed The goal is to identify: suspicous


  1. Network Traffic Analysis & Cluster Analysis Exploring Hadoop Clusters using Free Tools

  2. Background and Goals: • Apache Spot was started recently • DNS, Netflow, PCAP data is analyzed • The goal is to identify: ”suspicous connections” or: “dangerous activity”. • What is suspicious? • Apache Spot uses a topic-model approach, to classify traffic.

  3. Used Raw Data:

  4. Our Goals (midterm): • Use local context information instead of single package data only. (A) Temporal communication networks (B) Vectorization of measured properties from multiple sources • Consider additional communication layers: • Syslog • Webserver logs • Cloudera Manager events • Cloudera Navigator events

  5. About Event Processing: • Kafka gives an order only within a partition • Post-processing in Spark • HBase sorts rows by key • Table design is now strictly time related, which is not a very universal approach. • Kudu uses Primary Keys Each Kudu table must declare a primary key comprised of one or more columns. Primary key columns must be non-nullable , and may not be a boolean or floating-point type. Every row in a table must have a unique set of values for its primary key columns. As with a traditional RDBMS, primary key selection is critical to ensuring performant database operations. • But: Events have timestamps which are not really unique !!!

  6. Our Activities • Implement a data pipeline: • Kafka => Spark => HDFS => Notebook • Kafka => Spark => Kudu • Kudu => Spark => HDFS => (Notebook) • Create reference data sets • Scenario A: Terrasort (Big-Batch-Workload) • Scenario B: HDFS PUT,GET; HUE (Interactive Workload) • Scenario C: Idle cluster (Vacation time) • Scenario D: Kafka => Spark => Kudu (Realistic production Workload) • Scenario E: Twitter => Spark => Kudu (Realistic production Workload)

  7. Results • Scenario A: Batch workload • Scenario D: External data acquisition • Scenario E: Idle cluster

  8. Scenario A: TERRAGEN TERRASORT

  9. Scenario D: IDLE CLUSTER (some unknown activity in the background)

  10. First Iteration: • We organized our work in 3 phases: • Data and domain inspection + solution proposals • Environment setup • Tool centric: Jupyter, Eclipse, IntlliJ, CloudCat cluster, Git repository • Data centric:, Data collector tool, Demo data generation, Data formats • Data capturing and data generation • Analyzing the data in a well defined environment • Results are available in Git repos: • http://github.mtv.cloudera.com/kamir/Snaffer • https://github.com/mbalassi/packet-inspector • Increase functionality and knowledge by doing small iterations • Share code and knowledge

  11. How it works … • We collect raw data in Avro format, using the Snaffer script. • We transform the events to networks, using Hive. • We analyze and visualize the networks using Gephi.

  12. Outlook

  13. Entropy of Temporal Network • Time evolution of the network properties • Topology • Topological node properties

  14. Milestone One: • Follow a common DSP model (data science process model) • Use CDH default tools and gain experience • Work with Kafka (for input) and Hive tables (for input and output) • Implement a dataset profiling procedure, using Spark • Present results, using Jupiter notebook • Increase functionality and knowledge by doing small iterations • Share code and knowledge

  15. TODO (1) • Define data sources according to inspection methods • Define Avro schema and SOLR schema • Automatic dataset initalization / validation • DESCRIBE as WIKI and than instantiate via ANSIBLE

  16. TODO (2) • SNAProfiler • SQL for Network creation • Topology per time slice • Envelop: • Allows us to hook in the SNAProfiler component as a JAR.

  17. TODO (3) • Time Slice Preparation • KAFKA => Hbase • App—controledtime slice management: • (K,V) : (EXP_METRIC_TS, NETWORKDATA_as_edgelist) • Opposite to TIMESERIES presentation

  18. References • https://docs.google.com/document/d/12SHvTGJWtewk8CpUClOy22 mh7cUow18F_Jg2ZNNE3h8/edit#heading=h.r4wlzr2ctack • https://docs.google.com/document/d/1sD0_T2fQ7J5k7Ttx1vmAkYk MljMySgKFimm4hNVXxgA/edit# • http://research.ijcaonline.org/volume74/number17/pxc3890233.pdf • https://www.cs.princeton.edu/~blei/papers/BleiNgJordan2003.pdf

Download Presentation
Download Policy: The content available on the website is offered to you 'AS IS' for your personal information and use only. It cannot be commercialized, licensed, or distributed on other websites without prior consent from the author. To download a presentation, simply click this link. If you encounter any difficulties during the download process, it's possible that the publisher has removed the file from their server.

Recommend


More recommend